High Frequency System
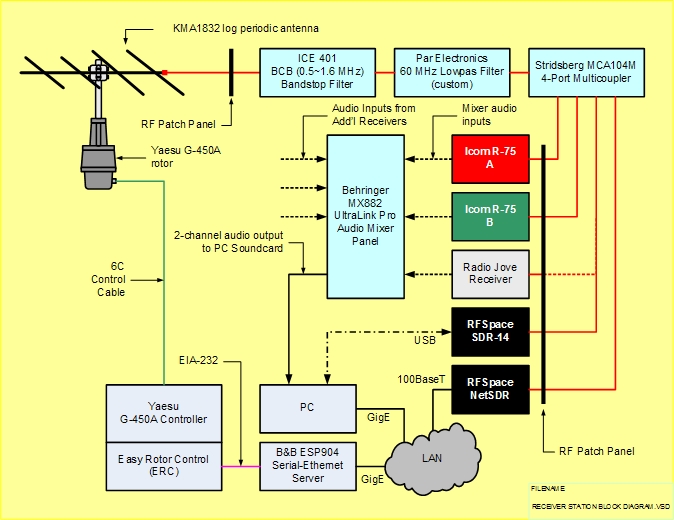
We captured our first solar burst with the HF System on May 8 and another on May 9, 2009. Click on the dated links below to go to Radio SkyPipe II charts and, when available, audio recordings and spectrograms. All charts were made from the audio output of Icom R-75 general coverage receiver operating in the frequency range 15~32 MHz or a Radio Jove Receiver operating around 20.1 MHz. Spectrograms were made with software defined radios, either the RFSpace SDR-14 or NetSDR, and spectrograph software, SpectraVue or Radio-Sky Spectrograph. Software defined radio receivers usually are setup to process the frequency range of 15 to 32 MHz. A block diagram is provided below.
Click on the links below for access to charts, spectrograms and audio recordings by year.
2009 2010 2011 2012 2013 2014-Present*
* After 2013 observations generally are described in summary papers and not individually
How to read the charts and spectrograms and listen to the audio recordings
Charts: The strip charts are in JPEG (.jpg) file format. They show the received power in terms of antenna temperature on the vertical scale (y-axis) and time in UTC on the horizontal scale (x-axis). The charts have one or more traces, and each trace represents one receiver set to a fixed frequency. The frequency setting usually is indicated on the chart along with other annotations. Explanatory text below the chart provides additional information such as locations on the charts of radio frequency interference (RFI).
Spectrograms: The spectrograms are in JPEG (.jpg) or portable network graphics (.png) file format. They show a range of frequencies along the vertical axis and time on the horizontal axis. The received power, usually in dBm, at any frequency and time is indicated by a colored pixel. The colors indicate relative power with black and blue indicating low power and orange and red (and white in some cases) indicating high power. Spectrogram quality varies greatly due to variation in ambient RFI levels and it is difficult to pick out the solar emissions in some of them. Where the emissions are weak with respect to the ambient noise level on the spectrogram, they will appear as a fuzzy puff that is slightly lighter than the background.
Audio recordings: All audio files are in the waveform audio file format (WAV). Listen to the audio in a quiet room or use high-quality headphones and avoid using laptop speakers. The recordings usually are in stereo and are hyperlinked to charts. Double-click the chart images as indicated. While charts show a 2 to 10 minute time period, the associated audio recordings normally are much shorter, from a few seconds to a minute, and cover only the main solar burst period. However, some solar bursts last several minutes and the associated audio recording files are quite large - at least one is 30 MB but most are 1~3 MB.
HF System Block Diagrams
The receiver system includes a multicoupler, filters and transmission lines. The antenna system is a log periodic antenna. It normally is setup for solar tracking in azimuth but is switched to fixed azimuth for Jupiter tracking when we observe Jupiter emissions. We use PstRotator rotor control software with its built-in solar tracking capability. When tracking Jupiter and other celestial objects except for Sun and Moon, we use PstRotator with Radio-Sky Publishing Radio Eyes.
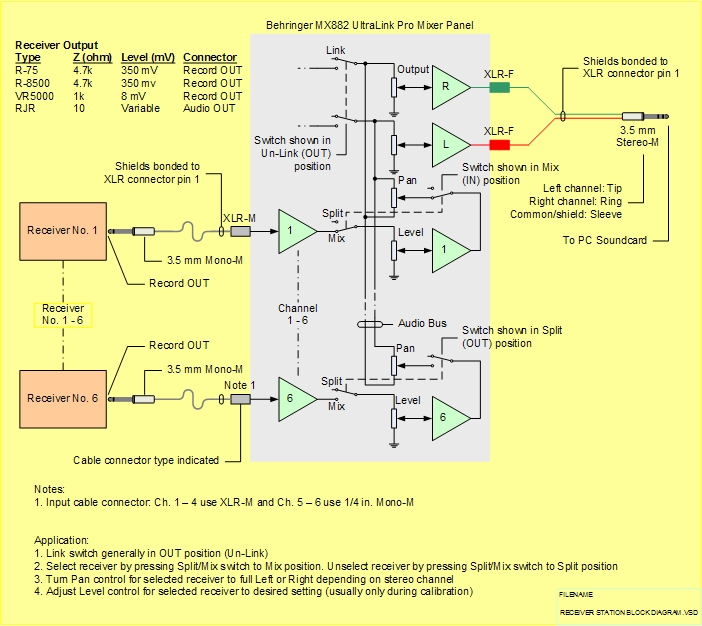
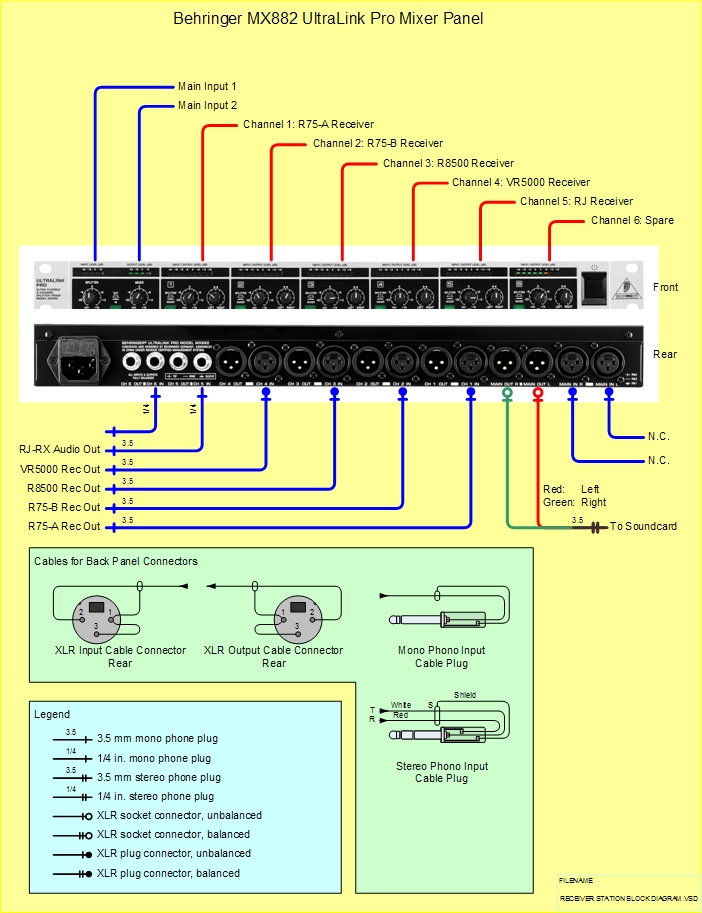
The drawings below show configuration and wiring details for the audio mixer.