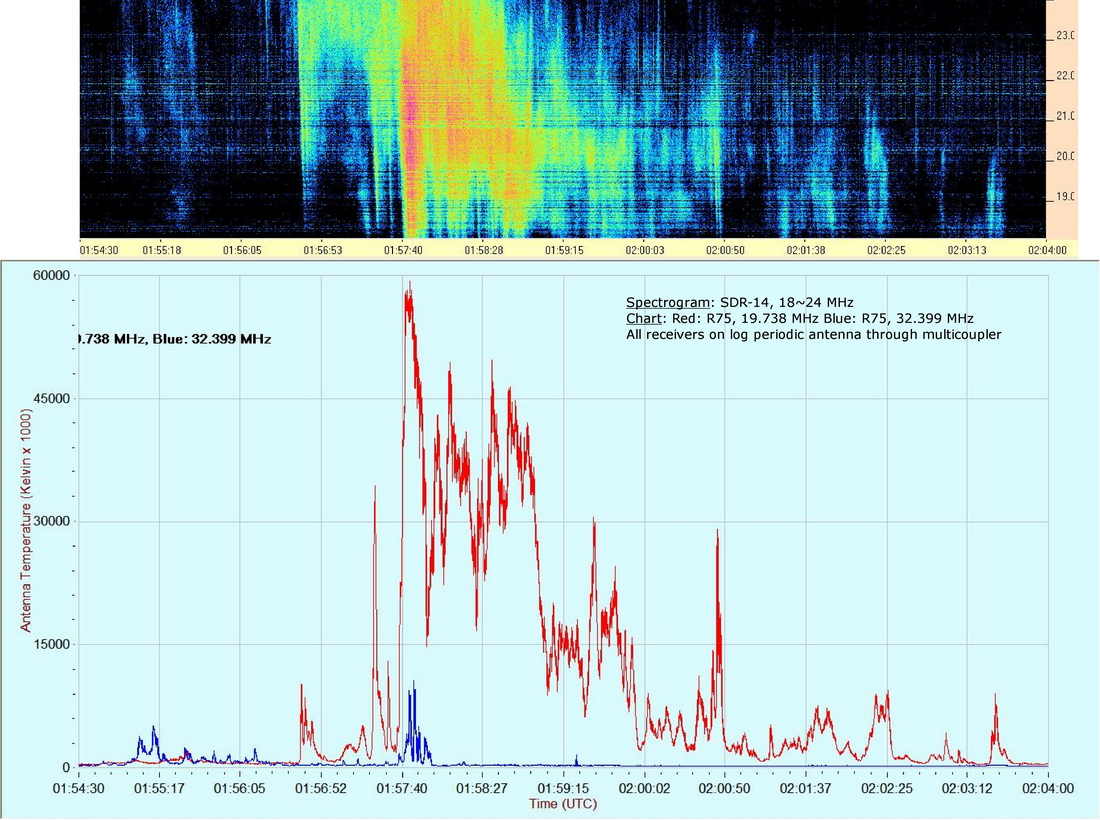
Solar Burst at about 0154 UTC 6 September, 2011. The spectrogram and chart have been arranged with the same time scales for comparison. See also the corresponding e-CALLISTO spectrogram here.
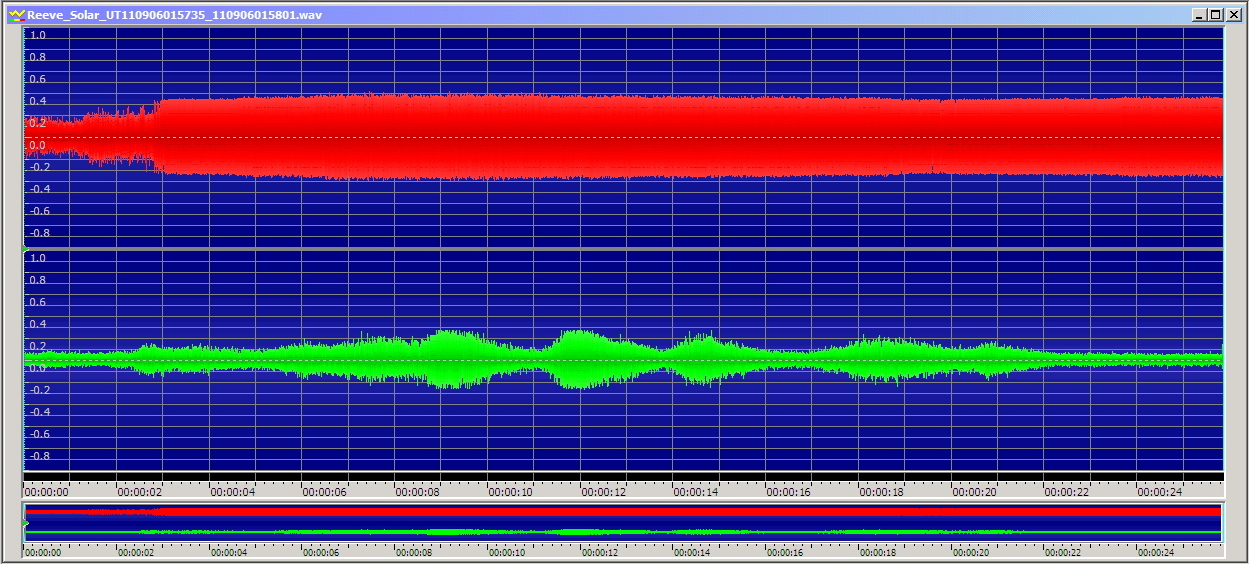
Click here for a stereo recording between 0157:35 and 0158:01, capturing the audio corresponding to both traces at about the time stamp 0157:40 in chart above. The left channel (red) almost overwhelms the right channel (blue) in the recording.
The audio oscillograph below corresponds to the recording between 0157:35 and 0158:01. The red trace in the oscillograph is the left channel and corresponds to the red trace above and the green trace in the oscillograph is the right channel and corresponds to the blue trace above. It is possible to pick out individual features in the right channel oscillograph and chart.