Solar Radio Observations for 06 June 2012
Where needed, additional descriptive information is provided below the images. Audio is available for these charts.
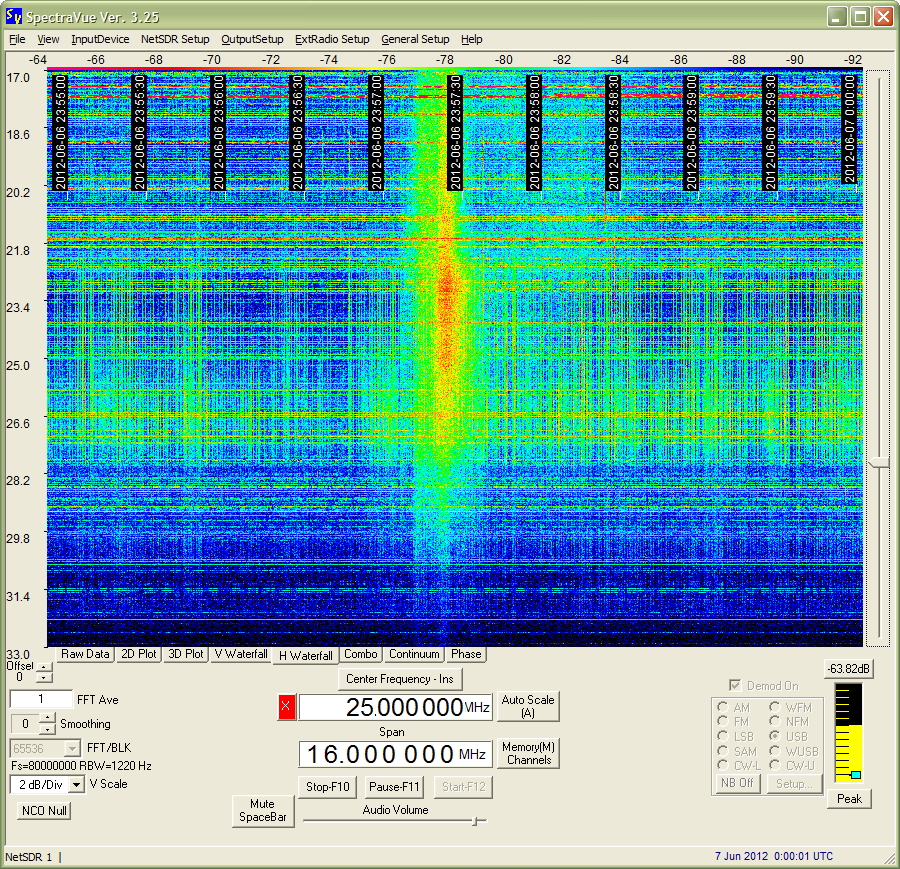
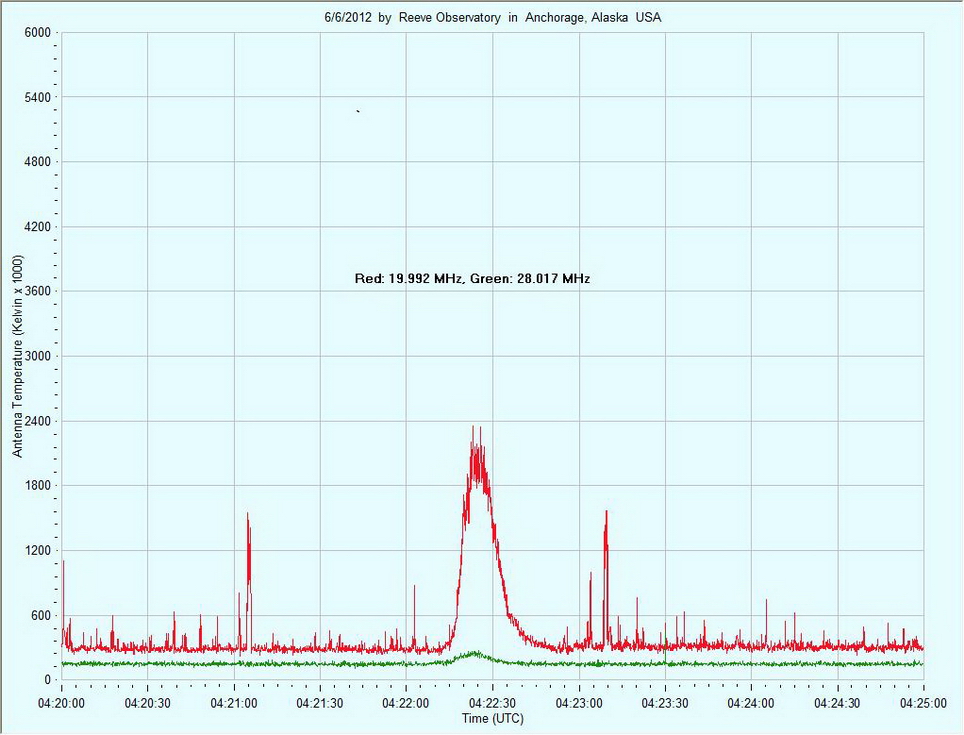
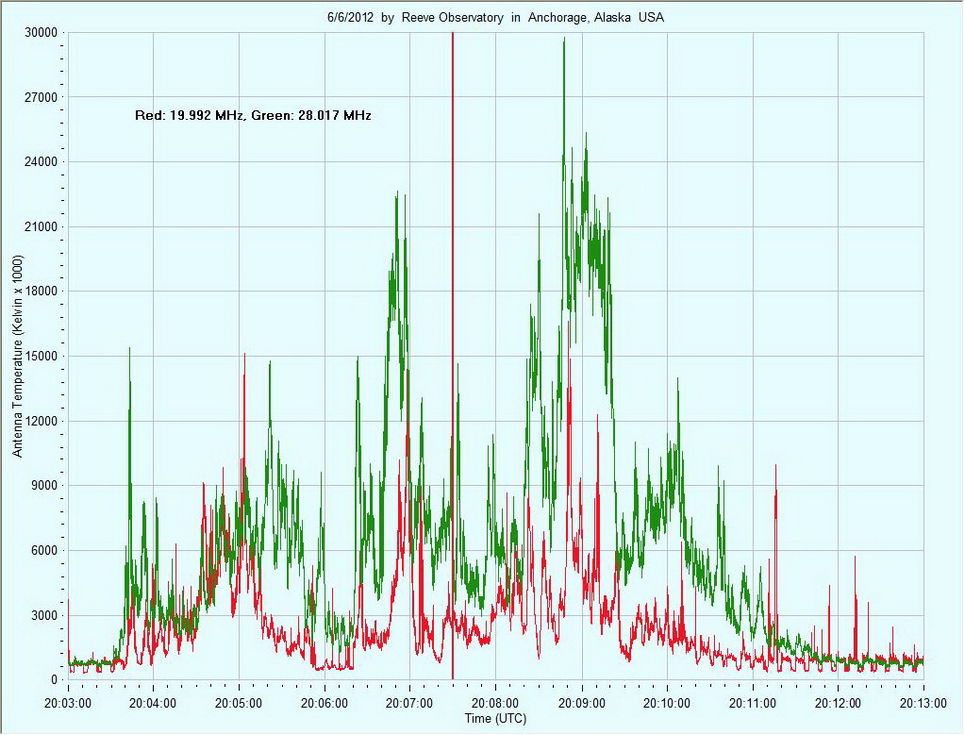
The solar burst shown on the chart above and spectrogram immediately below seemed to be stronger at the low and high frequencies and to have a gap in the middle frequencies.
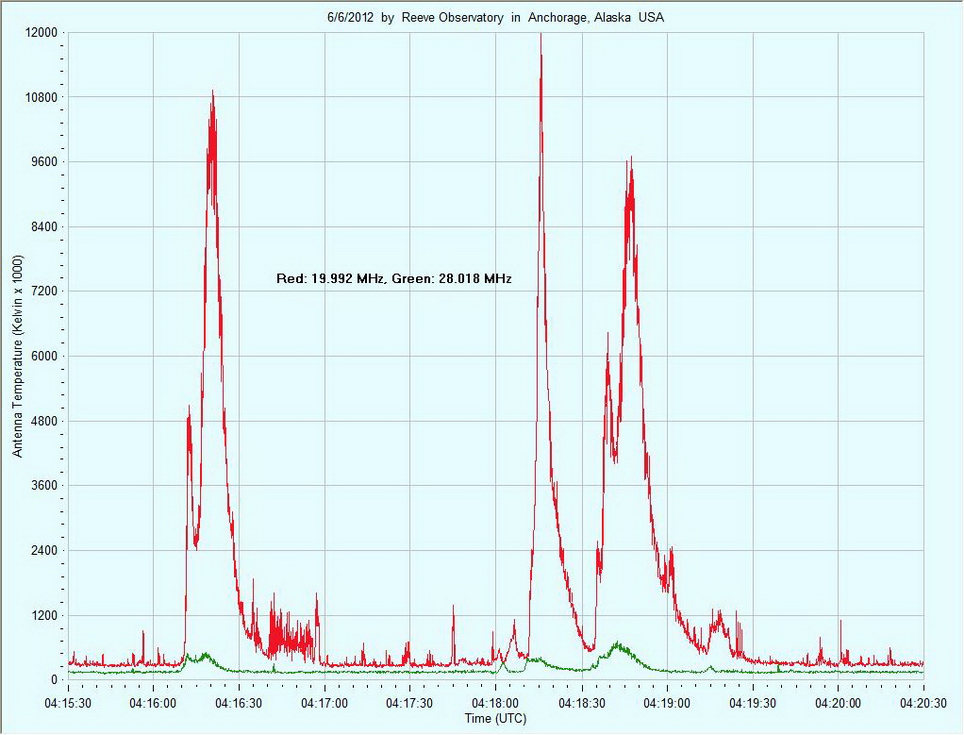
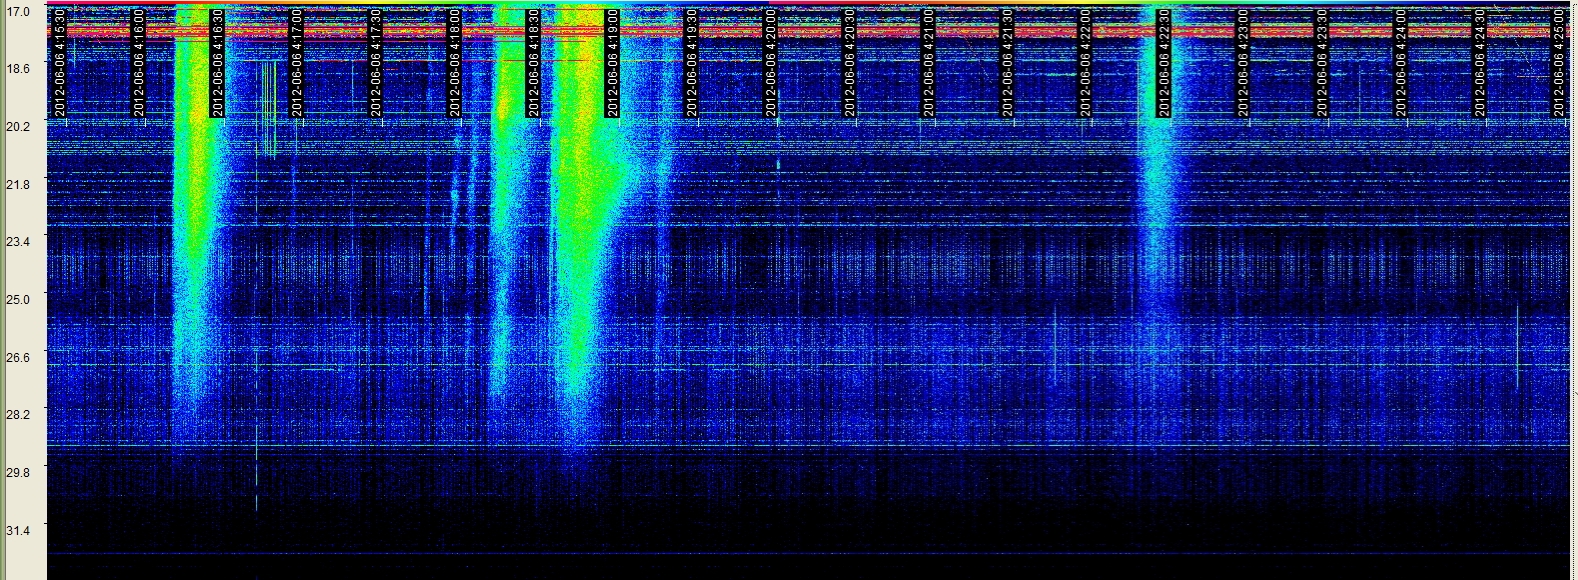
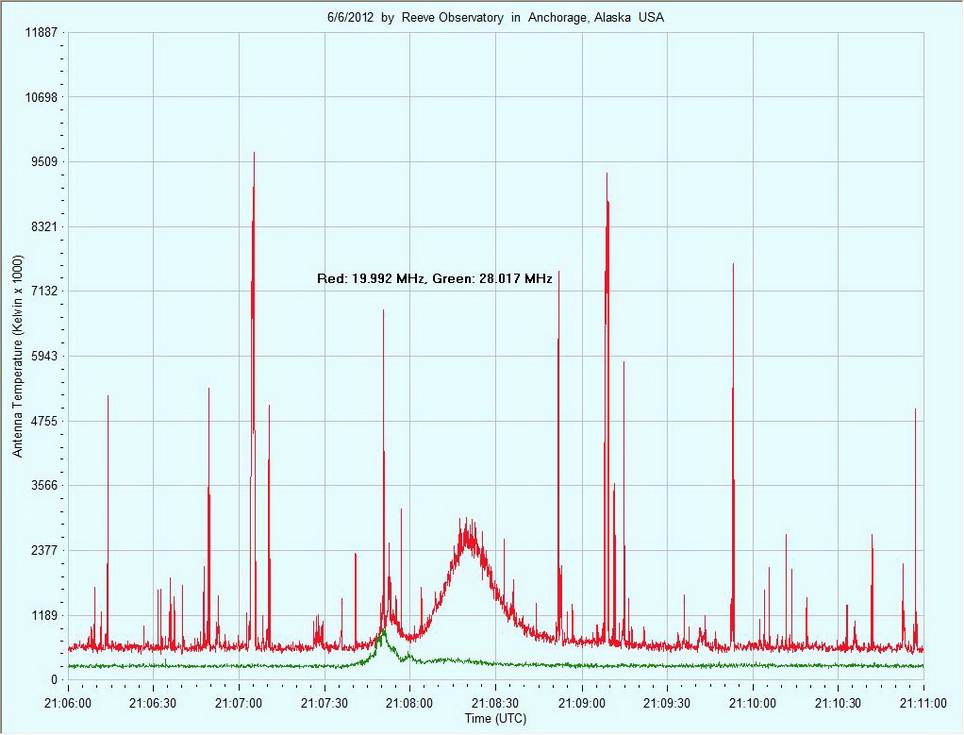
The chart above and spectrogram immediately below show three strong bursts with much higher power at lower frequencies.
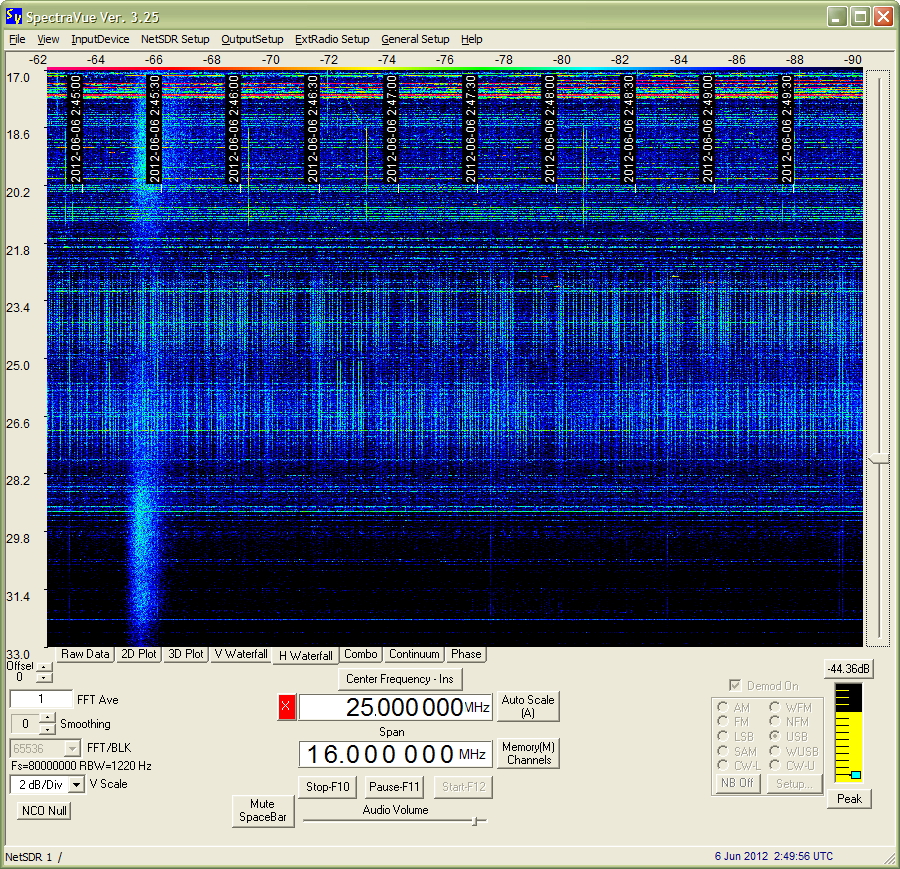
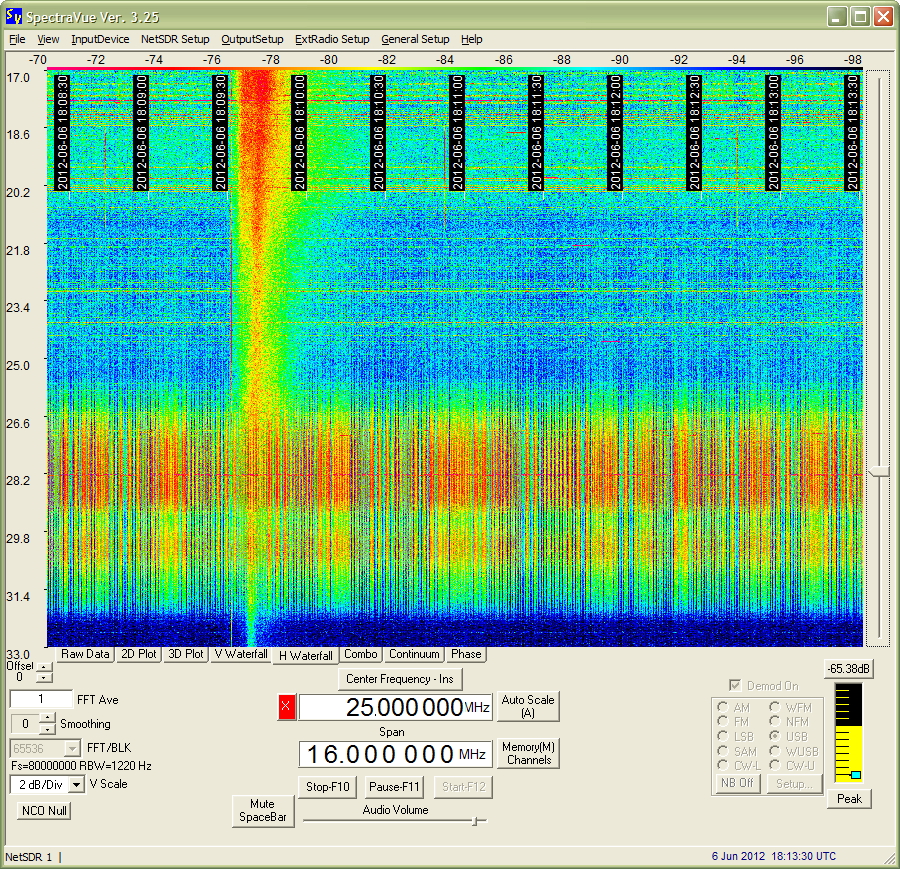
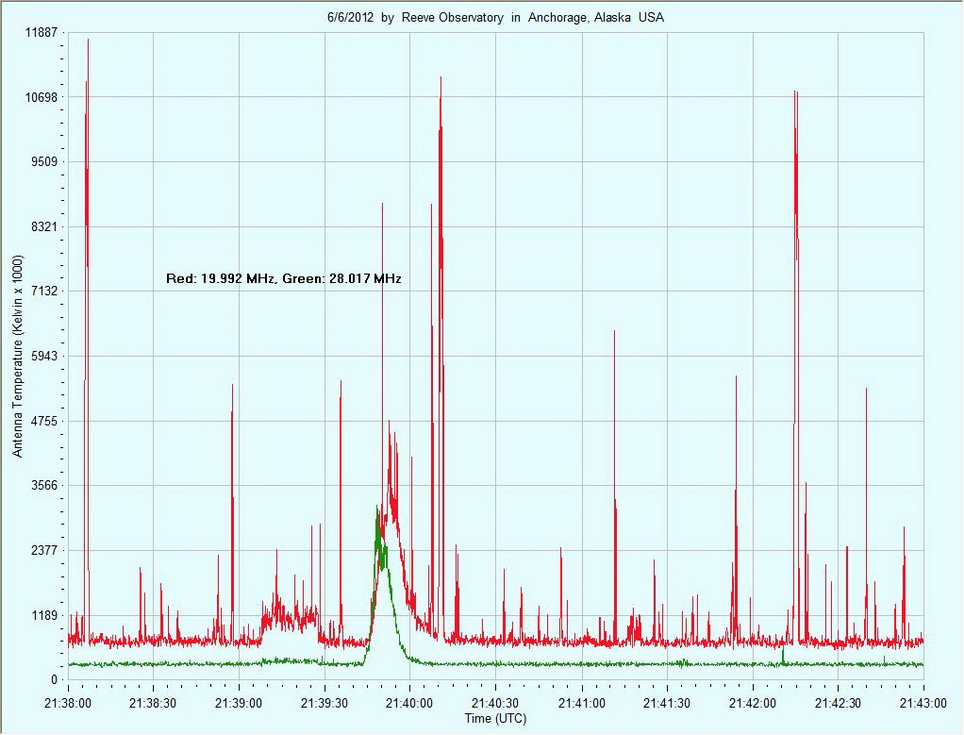
The solar burst shown in the chart above and spectrogram immediately below indicates strong radio frequency interference at the higher frequencies with the spectrogram showing a wide band of RFI from about 26 to 32 MHz. The solar burst covered the entire range of the spectrogram with an emphasis at lower frequencies.
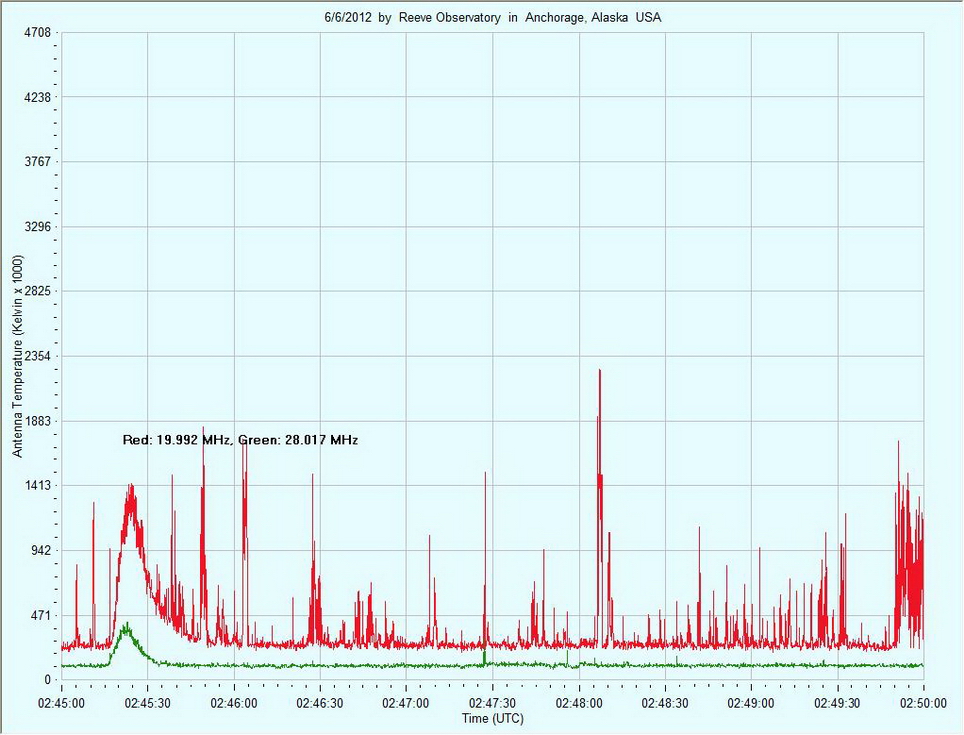
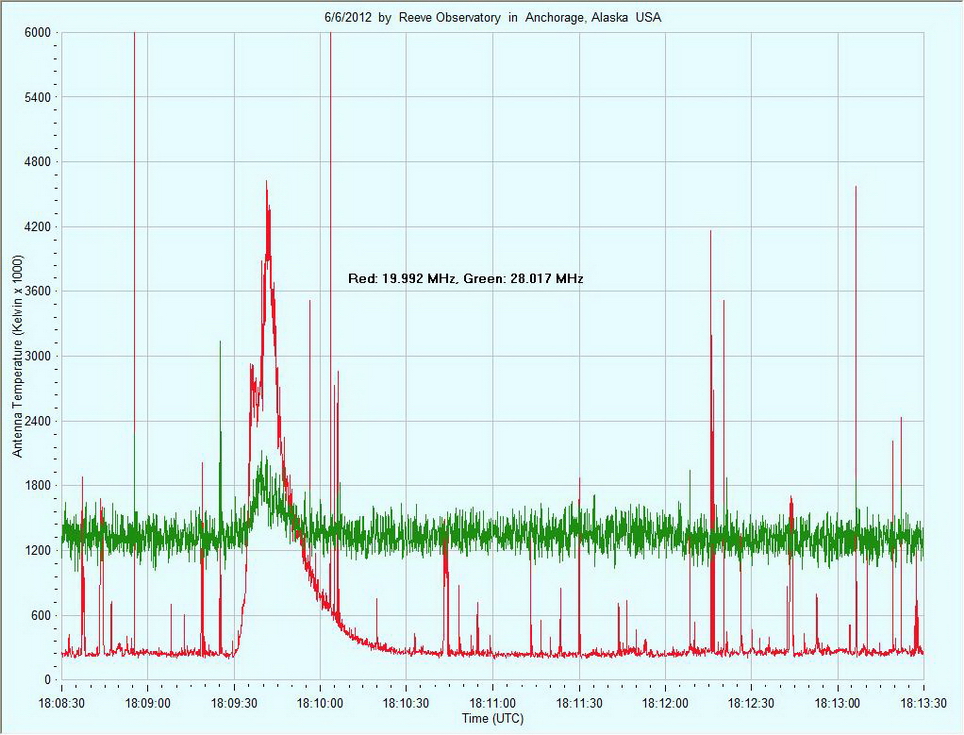
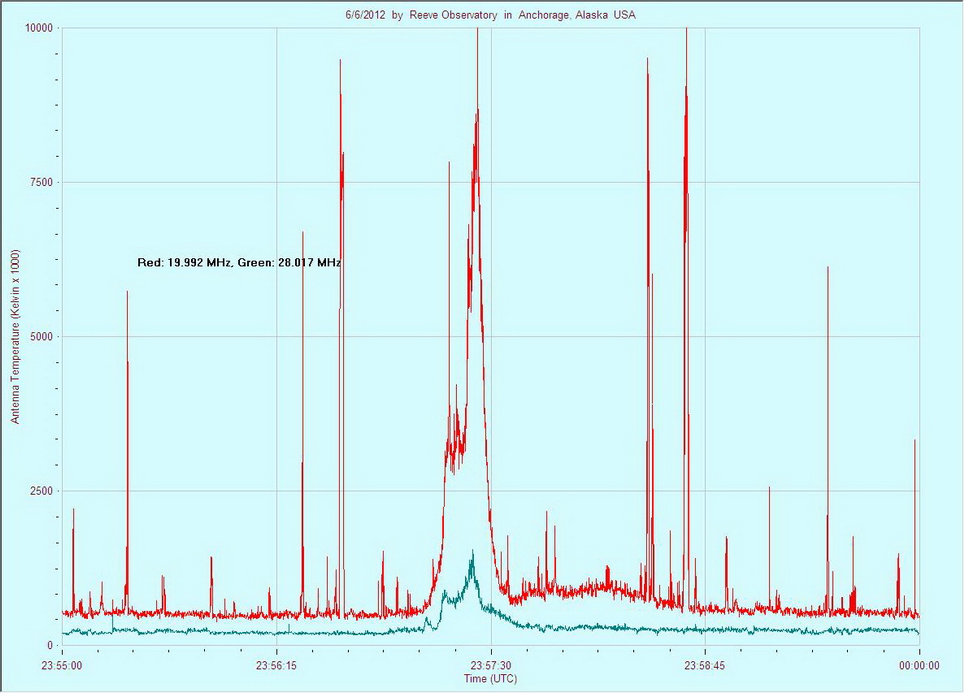
The chart above shows a 10 minute time span with a solar burst covering almost the full span. There was some periodic RFI at 20 MHz but it was overwhelmed by the solar burst.
Click on the above chart for audio associated with the solar burst.