Jupiter Io-B on 7 December 2011
This was a early-morning pass. We used two Icom R-75 HF
Receivers, one tuned to 19.638 MHz (LSB), corresponding to the Red trace in the charts below,
and the other tuned to 20.694 MHz (LSB), corresponding to the Green trace.
The receivers were connected to the antenna through a multicoupler. The antenna
was an 8-element log periodic antenna pointed about 249 degrees true (no tracking
was used). The ambient RF noise level in this direction was about 300k K during
the observation.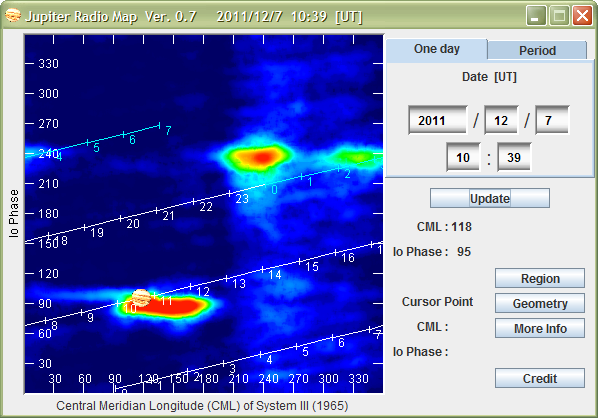
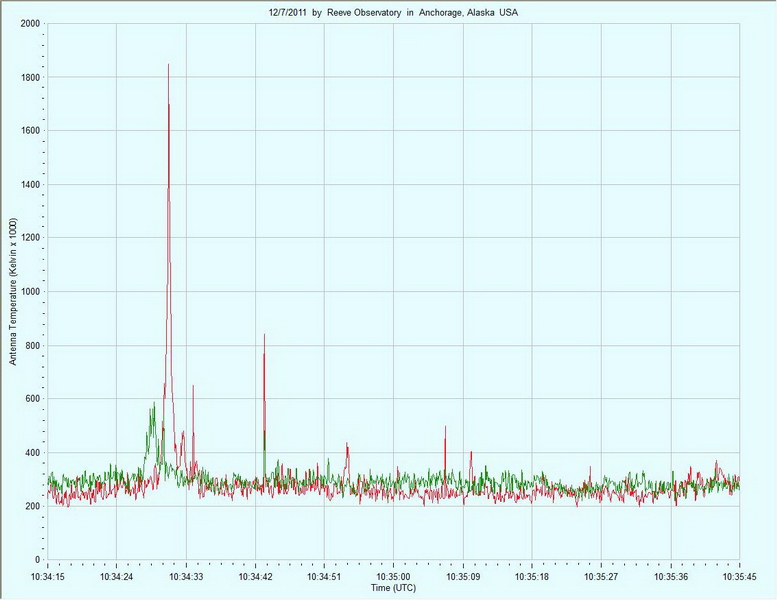
The predicted activity included an Io-B enhanced storm from about 0945 to 1145. We did not detect activity until about 1022. The storm lasted about 25 minutes, starting with weak bursts about 3 dB above the background noise and reaching a peak around 1039 with a very strong burst at about 6000k K. Neither frequency was preferred, although the highest intensities were received at 19.638 MHz.
The Jupiter Radio Map is for reference and shows the orientation of the Io-B enhanced source at the observation time. We observed mostly L-bursts with occasional S-bursts. Links to stereo sound files of the bursts are provided below the charts. Headphones are recommended, especially for the bursts early in the observation period. All times and dates are UTC.
Click here or on the first Radio SkyPipe chart below to watch a short video of 25.6 MHz celestial radio emissions recorded by the Long Wavelength Array (LWA) near Socorro, New Mexico just prior to the charts time line (Jupiter moved out of view of the LWA at about 1020). Jupiter emissions are clearly visible on the right (marked "Jup"). The original source videos were prepared at University of New Mexico with US government funding and we hereby acknowledge that source.
At the time of the charts Jupiter was at azimuth/elevation of approximately 245 degrees true and 25 degrees above the horizon.

The above chart shows the entire active period. The charts below show various segments.
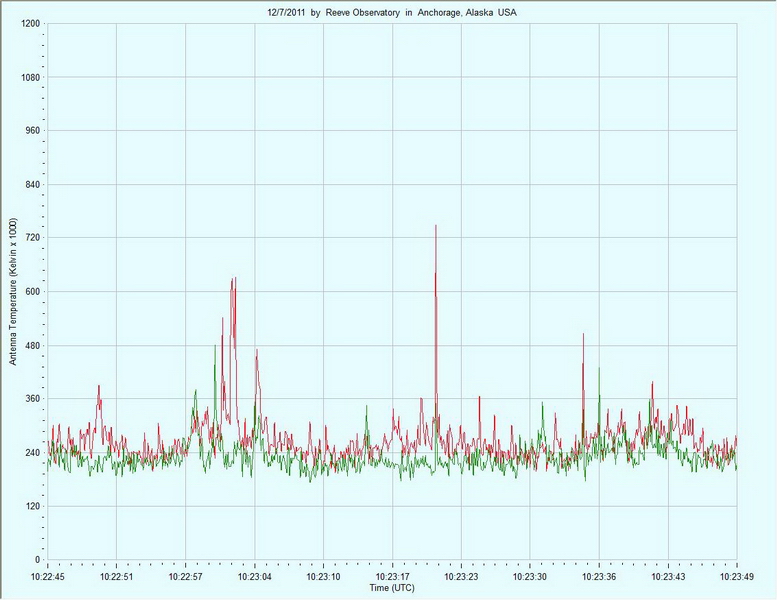
Click here to listen to a stereo sound file for the period of bursting in the chart above
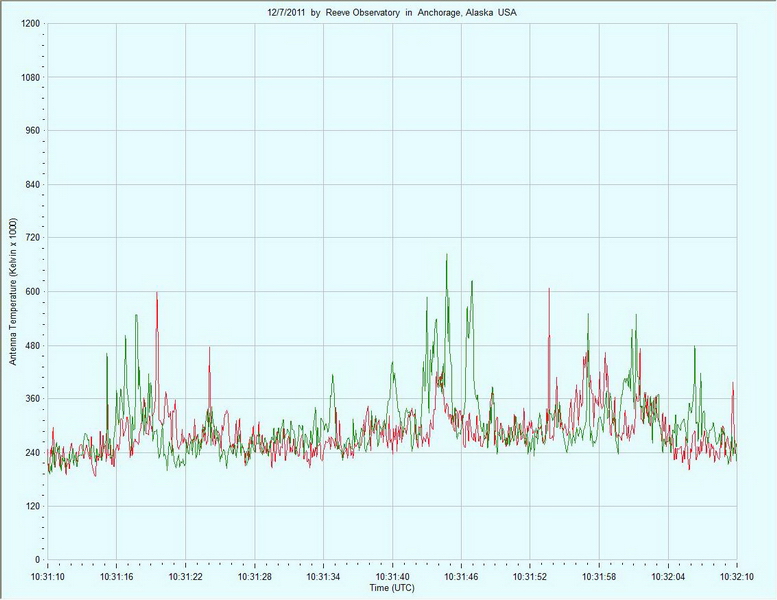
Click here to listen to a stereo sound file for the period of bursting in the chart above
Click here to listen to a stereo sound file for the period of bursting in the chart above
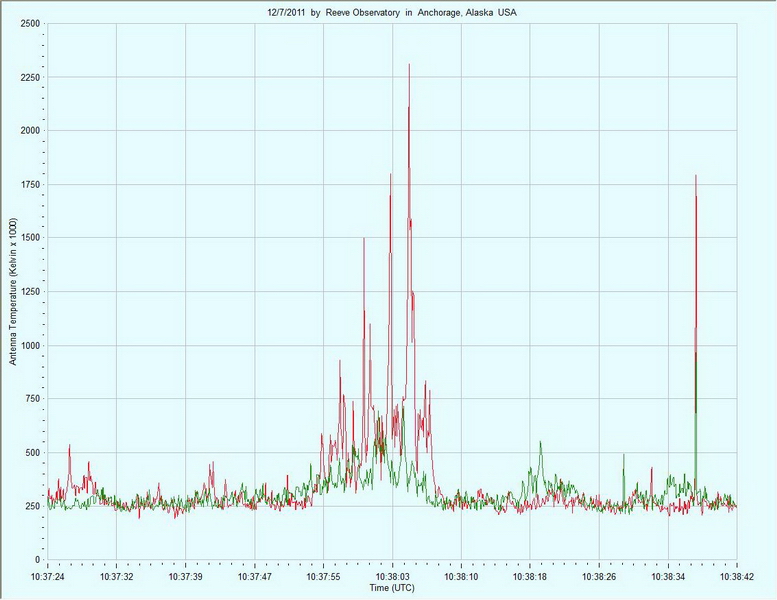
Note scale change. This was a fairly strong burst, about 2300k K. Click here to listen to a stereo sound file for the period of bursting in the chart above
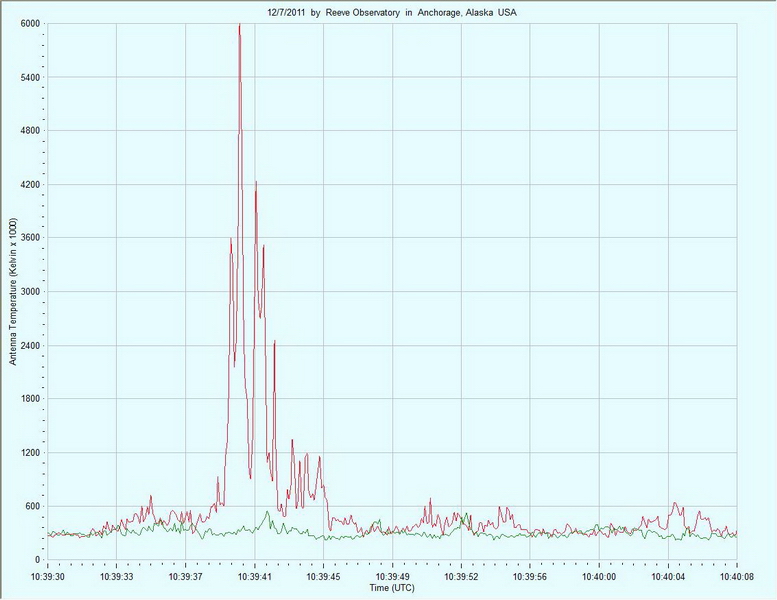
Note scale change. This was the most intense burst received during this observation, approximately 6000k K at 19.638 MHz. Click here to listen to a stereo sound file for the period of bursting in the chart above