Jupiter Io-B on 9 December 2011
This was a early-evening pass (starting about 1730 local
time). We used two Icom R-75 HF
Receivers, one tuned to 19.638 MHz (LSB), corresponding to the Red trace in the charts below,
and the other tuned to 20.719 MHz (LSB), corresponding to the Green trace.
The receivers were connected to the antenna through a multicoupler. The antenna
was an 8-element log periodic antenna pointed about 90 degrees true (no tracking
was used). The ambient RF noise level in this direction was about 200k K during
the observation.
The predicted activity included an Io-B enhanced storm from about 0230 to 0430. We may have detected activity almost immediately at about 0235 but the WAV recorder in Radio-SkyPipe malfunctioned during that period, and we could not verify. We did record S-bursts around 0300 and 0319. Bursts were moderate during these periods, about 4-5 dB above the background noise. The higher frequency (20.719 MHz) seemed to be preferred, at least initially, and may have been related to the drifting N-bursts (narrowband bursts) observed by Wes Greenman (LGM Radio Alachua) at 22 MHz.
The Jupiter Radio Map is for reference and shows the orientation of the Io-B enhanced source at the observation time. Links to stereo and mono sound files of the bursts are provided below the charts. Headphones are recommended. All times and dates are UTC.
At the time of the charts Jupiter was at azimuth/elevation of approximately 122 degrees true and 28 degrees above the horizon. Most of the large amplitude spikes seen in the charts below were due to frequent and strong sweepers.
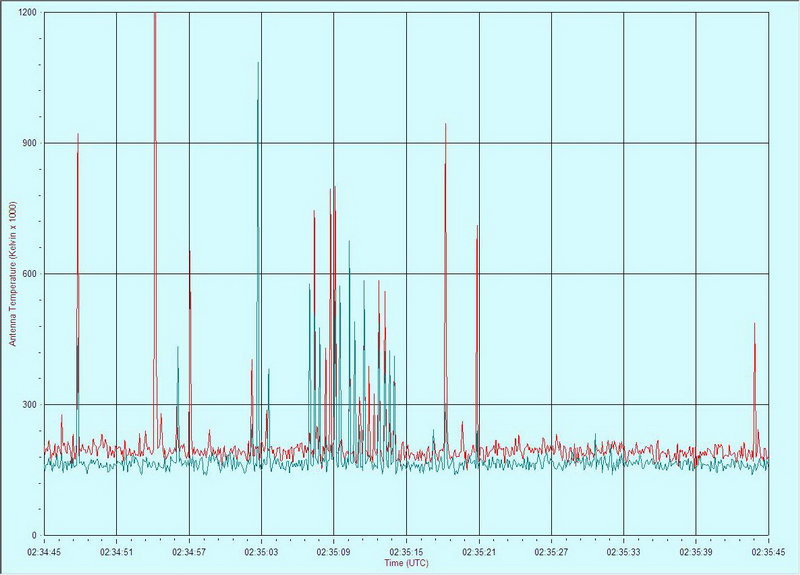
We were unable to verify the indications in the above chart, and they may be interference
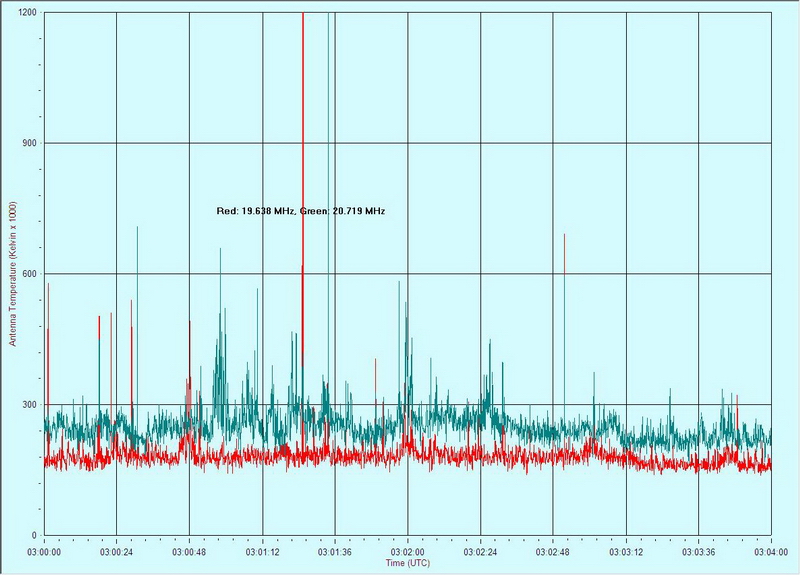
The above chart shows initial S-bursts at 0300:48 on the Red channel (19.638 MHz) drifting down to the Green channel (20.719 MHz). Click here to listen to a stereo sound file for the initial period of bursting in the chart above at 0300, and click here for subsequent bursting a couple minutes later on both channels at 0302
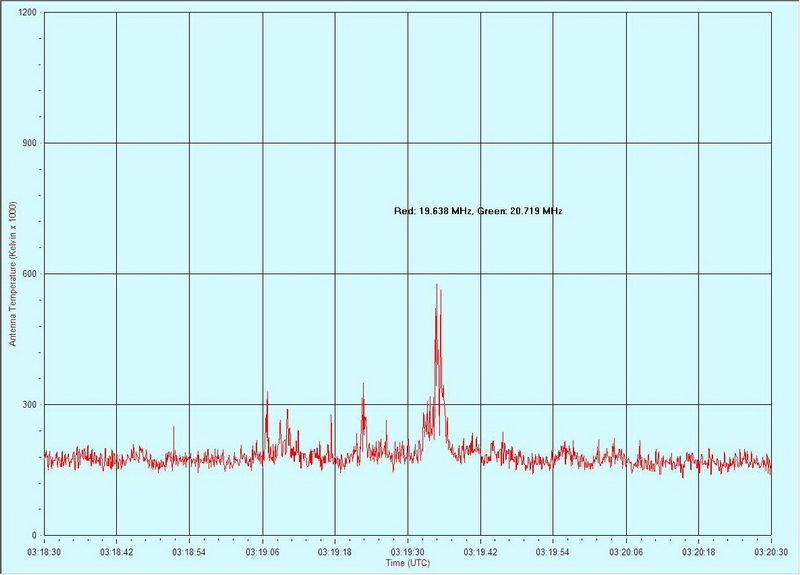
We captured S-bursts on the Red channel (19.638 MHz) at 0319. Click here for a mono recording corresponding to the middle portion of the chart above