Jupiter Io-B on 24 October 2011
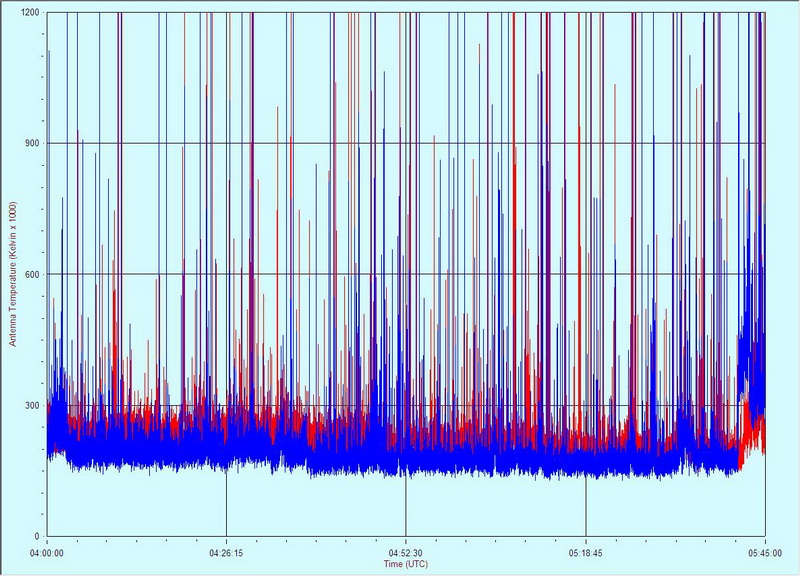
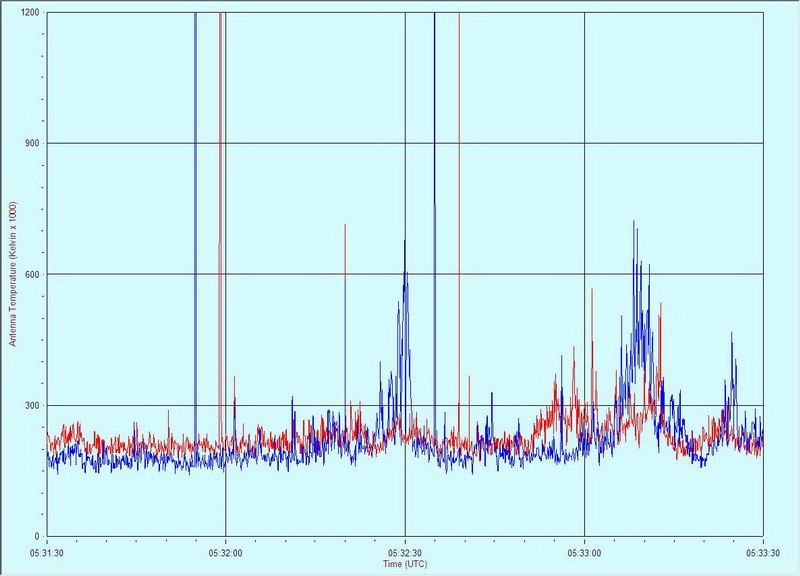
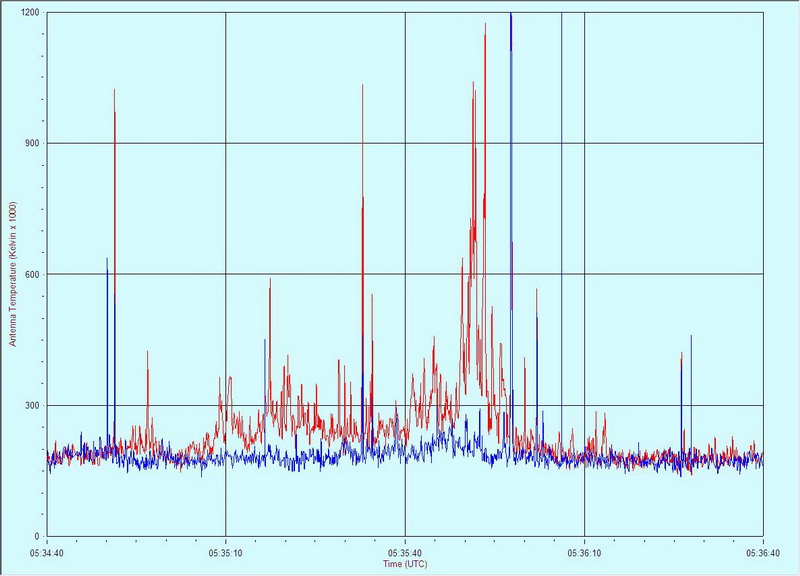
This was a mid- to late-evening pass. We used two Icom R-75 HF Receivers, one tuned to 20.100 MHz (LSB), corresponding to the Red trace in the charts below, and the other tuned to 19.575 MHz (LSB), corresponding to the Blue trace. The receivers were connected to the antenna through a multicoupler. The antenna was an 8-element log periodic antenna pointed about 100 degrees true (no tracking was used). Scroll down for charts.
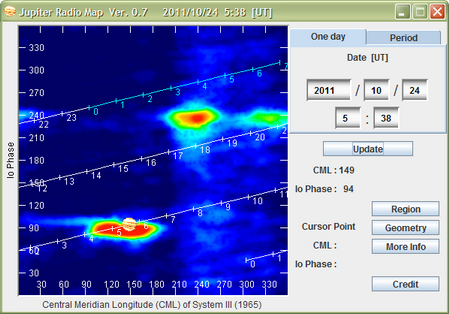 The Jupiter Radio Map is for reference
and shows the orientation of the Io-B enhanced source at the observation time.
We observed mostly S-bursts throughout the pass. There also was considerable
interference from sweepers and other repetitive signals. The upper Radio SkyPipe chart
shows the predicted period from 0400 to 0645, but there is not much useful
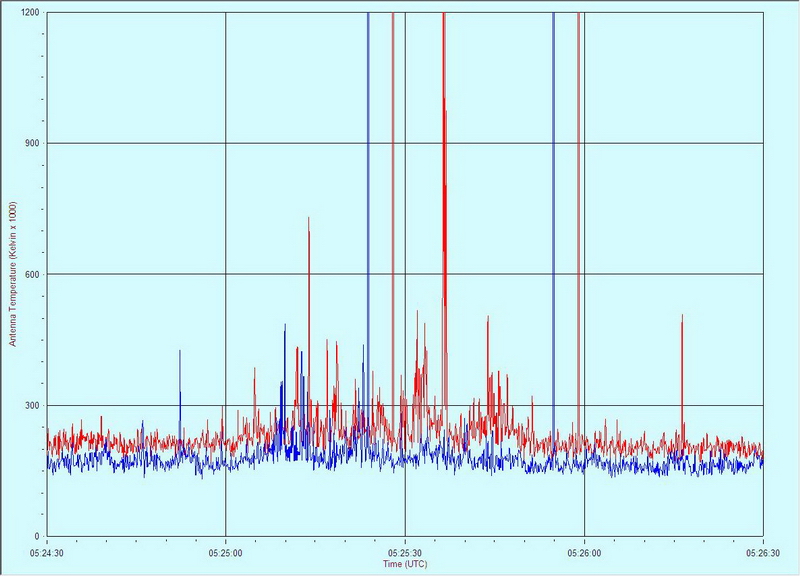
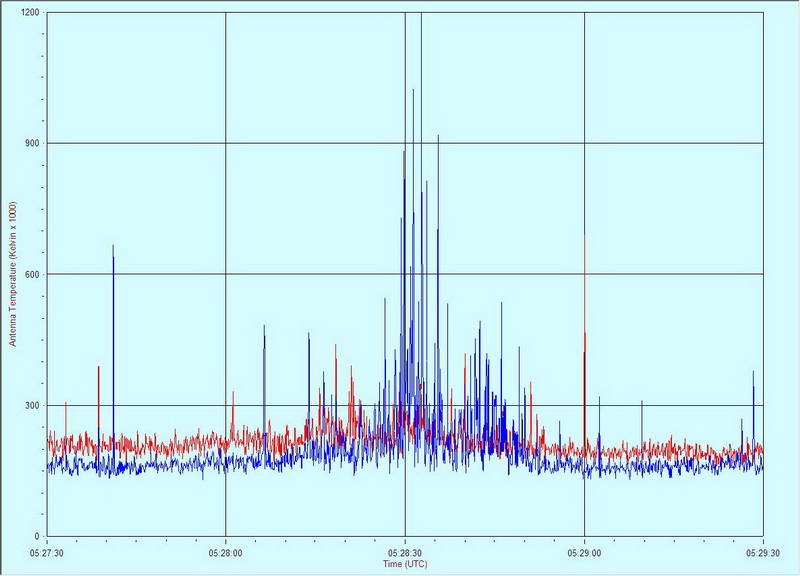
information in it. The subsequent charts show individual periods with expanded
time scales and easily discernible bursting, especially when listening to the
associated audio files. Links to stereo sound files of the bursts are provided
below the charts. All times and
dates are UTC.
The Jupiter Radio Map is for reference
and shows the orientation of the Io-B enhanced source at the observation time.
We observed mostly S-bursts throughout the pass. There also was considerable
interference from sweepers and other repetitive signals. The upper Radio SkyPipe chart
shows the predicted period from 0400 to 0645, but there is not much useful
information in it. The subsequent charts show individual periods with expanded
time scales and easily discernible bursting, especially when listening to the
associated audio files. Links to stereo sound files of the bursts are provided
below the charts. All times and
dates are UTC.
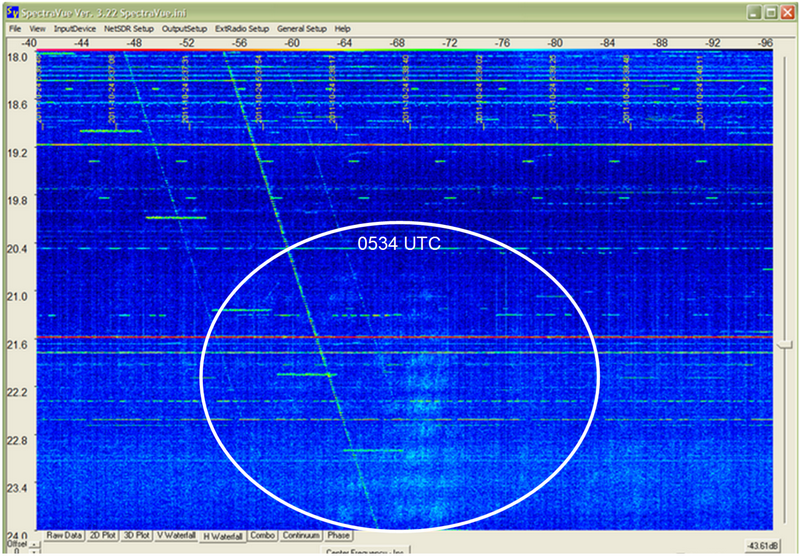
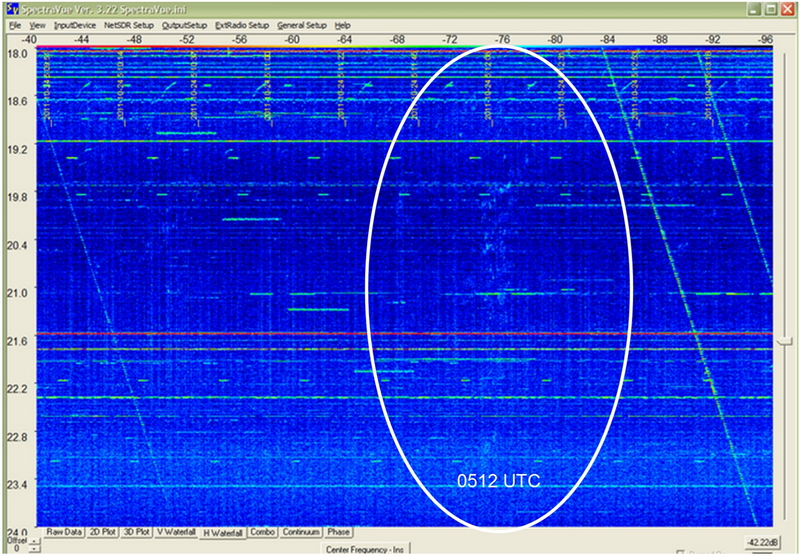
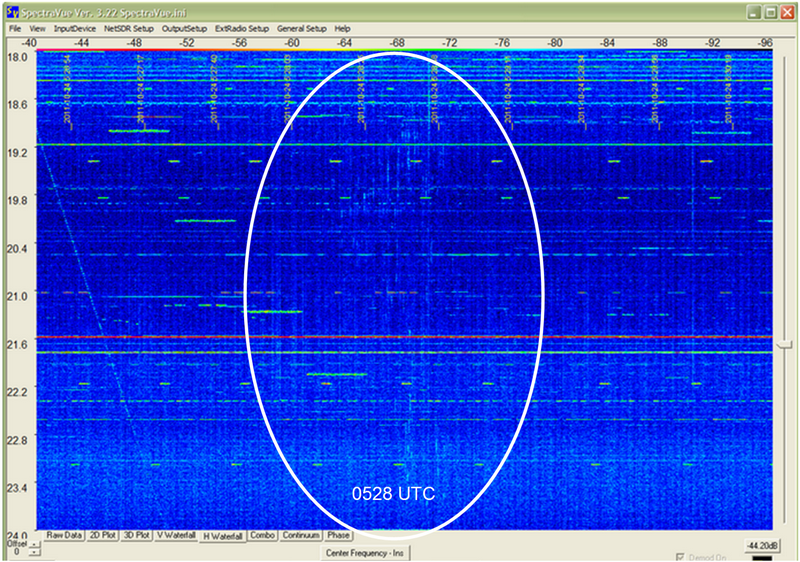
Below the Radio SkyPipe charts are annotated spectrograms made with SpectraVue software and an RFSpace NetSDR software defined radio. The NetSDR was connected to the same antenna and multicoupler mentioned above. Whereas the Radio SkyPipe charts show received power at discrete frequencies (20.1 and 19.575 MHz for these observations), the spectrograms show the received power over a range of frequencies. Each pixel in the spectrogram has three attributes - frequency, time and received power. The spectrograms show a frequency range of 18 to 24 MHz on the vertical scale and a time span of about 3 minutes on the horizontal scale. The received power is indicated by color. Black or dark indicates low power and lighter indicates higher power.
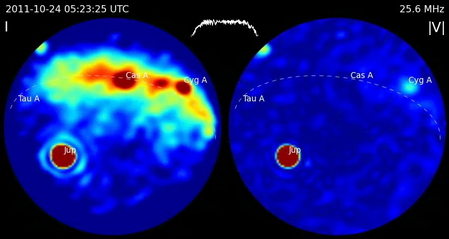
Click on any of the Radio SkyPipe charts below to watch a short video of 25.6 MHz celestial radio emissions recorded by the Long Wavelength Array (LWA) near Socorro, New Mexico (example frame right). Jupiter emissions are clearly visible (marked "Jup"). The video is about 20 seconds long and approximately concurrent with the charts from 0511 to 0537. The original source videos were prepared at University of New Mexico with US government funding and we hereby acknowledge that source. Click here for information on LWA and here for the source files we use.
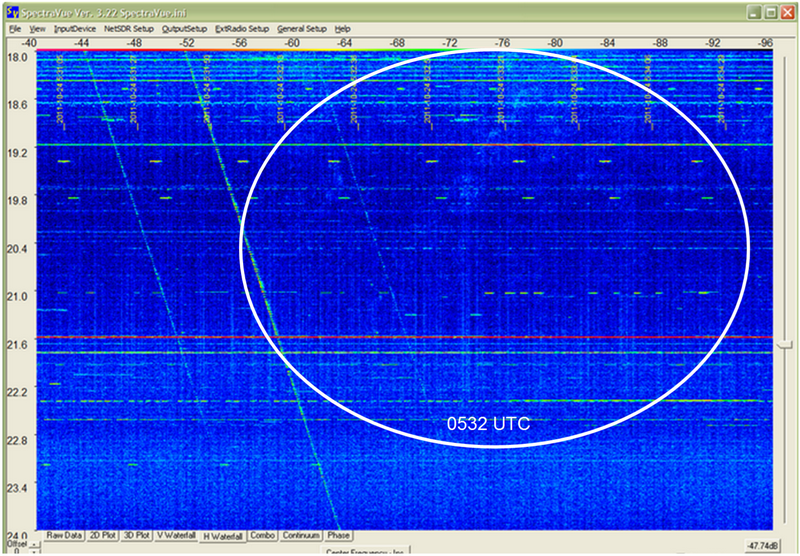
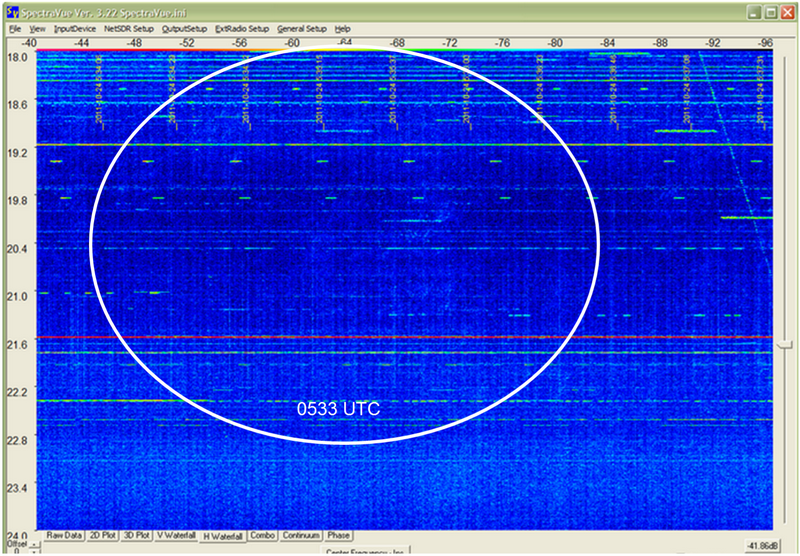
We suffer considerable radio frequency interference (RFI) and the received emissions from Jupiter are only a few dB above the background RFI. The white ellipses on the spectrograms encircle areas with discernible Jupiter emissions, seen as cloudy nebula. Examining the spectrograms sequence from top to bottom of this page reveals that the Jupiter emissions suddenly migrated from lower frequencies to higher frequencies toward the end of the recorded storm. Increased RFI ended our observations around 0600. The slanted lines on the spectrograms are thought to be over-the-horizon radars (OTHR) and are called "sweepers" because they sweep through the spectrum. Horizontal lines are fixed carrier frequencies. The source of these carriers as well as the "curly" RFI at around 18.5 MHz are unknown.
At the time of the charts Jupiter was at azimuth/elevation of approximately 100 degrees true and 19 degrees above the horizon.
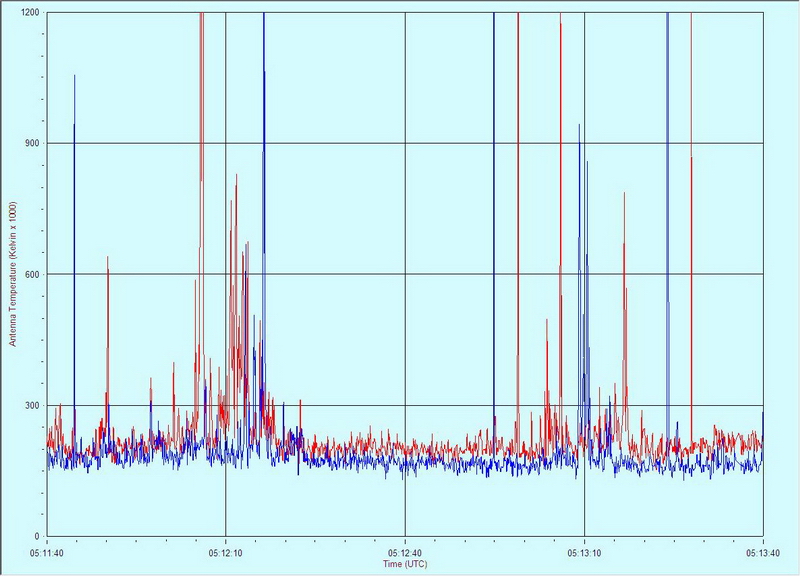
Click here for a stereo audio file associated with the bursting in 0512:10
Click here for a stereo audio file associated with the bursting shown
Click here for a stereo audio file associated with the bursting shown at about 0532:30
Click here for a stereo audio file associated with the bursting shown at about 0533:00
Click here for a stereo audio file associated with the bursting shown