Jupiter Io-B on 31 October 2011
This was a mid- to late-evening pass. We used two Icom R-75 HF Receivers, one tuned to 19.475 MHz (LSB), corresponding to the Red trace in the charts below, and the other initially tuned to 20.651 MHz (LSB), corresponding to the Blue trace. The receivers were connected to the antenna through a multicoupler. The antenna was an 8-element log periodic antenna pointed about 91 degrees true (no tracking was used).
 The predicted activity included an Io-B enhanced storm
from 0450 to 0740. We detected some brief periods of activity with the Red
receiver (19.475 MHz) at 0537 through 0542 and 0618 through 0633.
The predicted activity included an Io-B enhanced storm
from 0450 to 0740. We detected some brief periods of activity with the Red
receiver (19.475 MHz) at 0537 through 0542 and 0618 through 0633.
We attempted to chase the emissions spectrum with the second receiver by tuning it to what we thought were Jupiter emissions at higher frequencies shown on our software defined radio spectrograph. We stepped from 20.651 MHz at the beginning of the period to 22.186 MHz at 0518, 23.853 MHz at 0533 and back down to 20.094 MHz at 0639. However, the emissions were elusive and we detected none in the recorded audio.
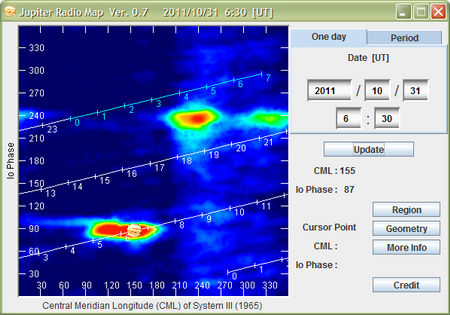
The Jupiter Radio Map is for reference and shows the orientation of the Io-B enhanced source at the observation time. We observed L-bursts during the brief periods of the audio recordings. The charts below show the two brief reception periods of low-level bursting with expanded time scales. Links to mono sound files of the bursts are provided below the charts. All times and dates are UTC.
 Click on any of the Radio SkyPipe charts below
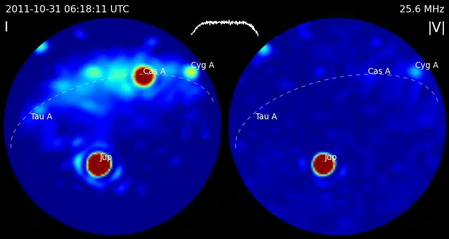
(except the first one) to watch a short video of 25.6
MHz celestial radio emissions recorded by the Long Wavelength Array (LWA) near
Socorro, New Mexico (example frame right). Jupiter emissions are clearly visible (marked "Jup"). The video is about 15 seconds long and
approximately concurrent with the charts from 0616 to 0635. The original source videos were
prepared at University of New Mexico with US government funding and we hereby
acknowledge that source. Click
here for information on LWA and here
for the source files we use.
Click on any of the Radio SkyPipe charts below
(except the first one) to watch a short video of 25.6
MHz celestial radio emissions recorded by the Long Wavelength Array (LWA) near
Socorro, New Mexico (example frame right). Jupiter emissions are clearly visible (marked "Jup"). The video is about 15 seconds long and
approximately concurrent with the charts from 0616 to 0635. The original source videos were
prepared at University of New Mexico with US government funding and we hereby
acknowledge that source. Click
here for information on LWA and here
for the source files we use.
At the time of the charts Jupiter was at azimuth/elevation of approximately 124 degrees true and 30 degrees above the horizon.
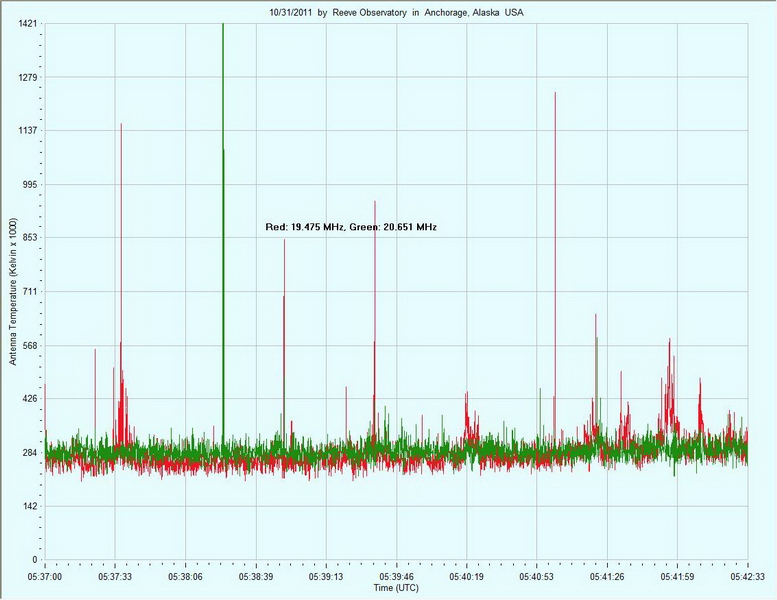
Note: We changed trace colors for the above chart (color code indicated on chart). Weak bursts can be seen on the Red trace at about 0537:30, 0540:19 and 0541:26 to 0542:15. Click here to listen to a mono sound file for the first bursts at about 0537:30 that were detected by Receiver A (19.475 MHz).

Click here for a mono audio file corresponding to the red trace at about 0618 (19.475 MHz)
Click here for a mono audio file corresponding to the red trace at about 0619 (19.475 MHz)
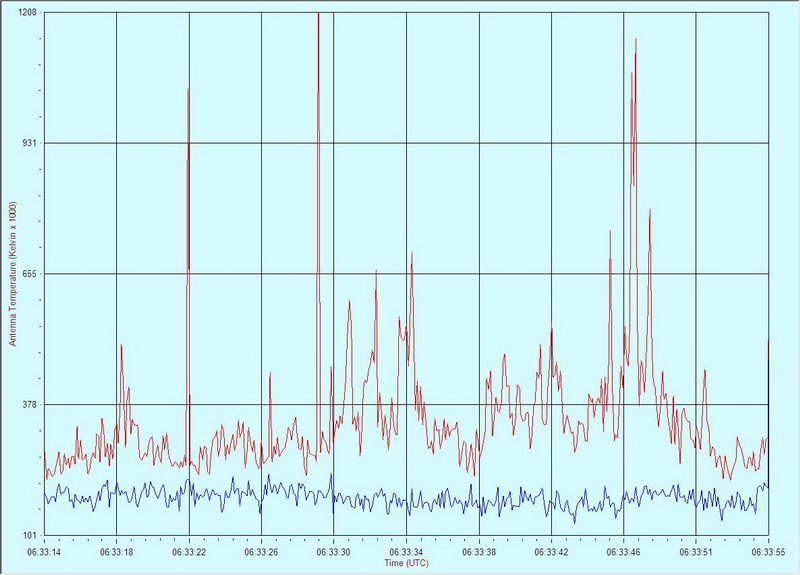
Click here for a mono audio file corresponding to the red trace at about 0633:30 (19.475 MHz)
Click here for a mono audio file corresponding to the red trace at about 0633:46 (19.475 MHz)