Jupiter Io-B on 14 December 2011
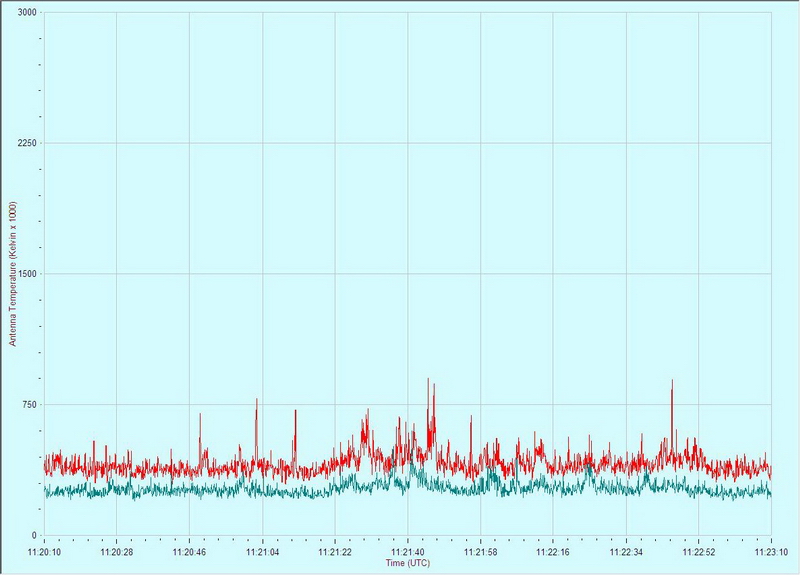
This was a early-morning pass (starting about 0130 local time). We used two Icom R-75 HF Receivers, one tuned to 19.897 MHz (LSB), corresponding to the Red trace in the charts below, and the other tuned to 20.342 MHz (LSB), corresponding to the Green trace. The receivers were connected to the antenna through a multicoupler. The antenna was an 8-element log periodic antenna pointed about 265 degrees true (no tracking was used).
The ambient RF noise level in this direction was about 250k to 350k K during
the observation, depending on frequency.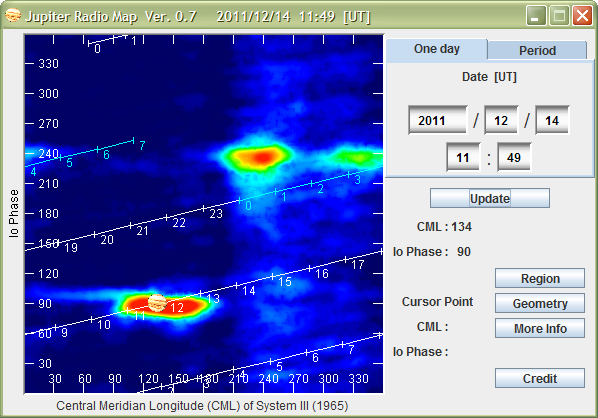 RFI with a popping sound is apparent in the recordings. It started when we had
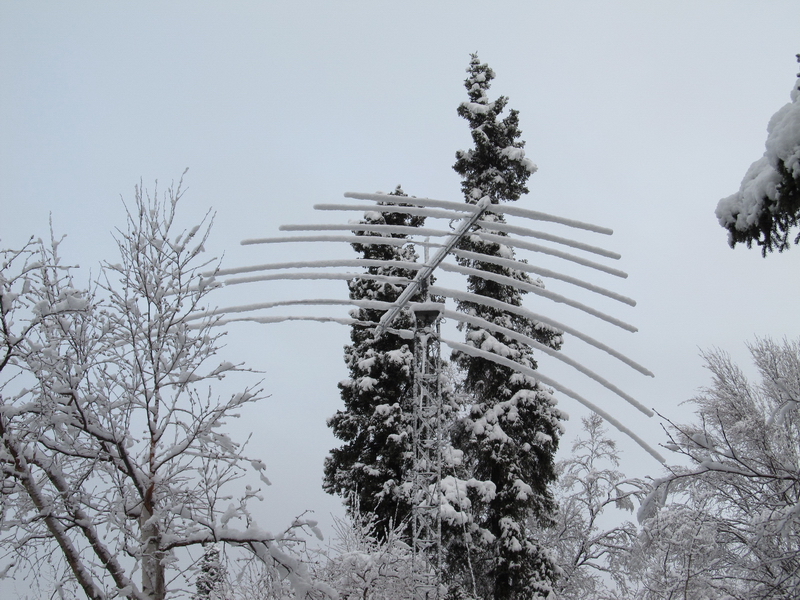
heavy snows. At the end of this page is a photograph of our snow-covered log
periodic antenna used in these observations.
RFI with a popping sound is apparent in the recordings. It started when we had
heavy snows. At the end of this page is a photograph of our snow-covered log
periodic antenna used in these observations.
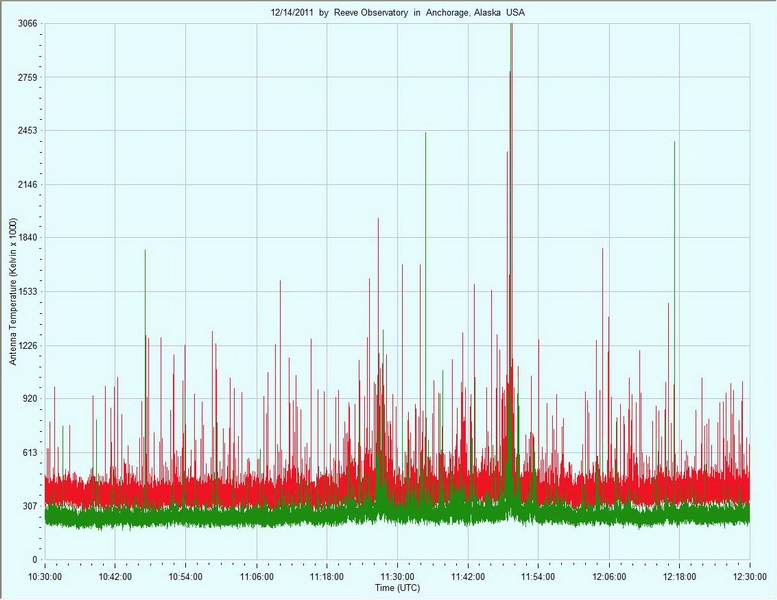
The predicted activity included an Io-B enhanced storm from about 1030 to 1215. We detected activity almost immediately at 1034. We recorded mostly L-bursts, but there also were some occasional S-bursts. Later in the observation period we detected a burst at 6800k K followed 15 seconds later by a burst at almost 4000k K. There were many bursts that exceeded 2000k K. The bursts seem to prefer the lower frequency (19.897 MHz) at first but around 1120 both frequencies seemed to have similar activity.
The Jupiter Radio Map is for reference and shows the orientation of the Io-B enhanced source at the observation time. Links to stereo and mono sound files of the bursts are provided below the charts. Headphones are recommended. All times and dates are UTC.
At the time of the charts Jupiter was at azimuth/elevation of approximately 265 degrees true and 15 degrees above the horizon. The Radio-SkyPipe immediately below shows the entire observation period at both frequencies. As seen, the storm peaked at 1149.
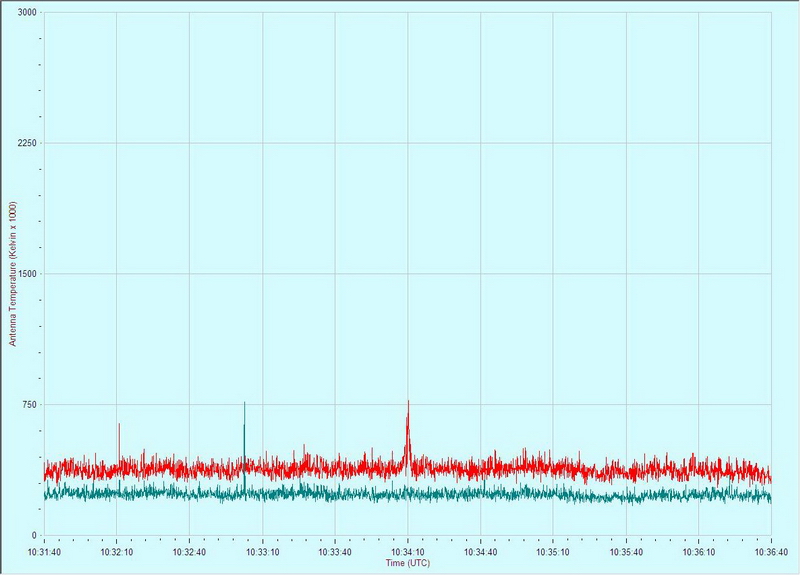
The first L-burst was received at 1034 on the Red channel (19.897 MHz). Click here for a mono recording of it. The burst is weak but clear.

The next detected burst occurred just before 1052, again on the lower frequency. Click here for a mono recording of the strong burst followed by weaker bursts.

The L-bursts continued at the lower frequency as seen in the chart above. Click here for a mono recording of two L-bursts.
The above chart provides the first indications of burst activity at the higher frequency (Green channel at 20.342 MHz). The bursts on the lower channel mostly were L-bursts but some S-bursts also occurred. The bursts on the higher channel were L-bursts. Click here for a stereo recording of the activity shown in the middle of the above chart.

The above chart shows some strong S-bursts and L-bursts. Click here for a stereo recording of them.

Note vertical scale change. The above chart shows very strong bursts on both channels. The strongest burst, about 6800k K, occurred on the higher channel (20.342 MHz) at 1149:15, and another one, almost 4000k K occurred 15 seconds later. Click here for a stereo recording corresponding to the times shown

Toward the end of the storm, bursts were recorded on the higher channel but the lower channel also was active. Click here for a recording corresponding to the above chart.