Jupiter Io-B on 19 October 2012
 This was an
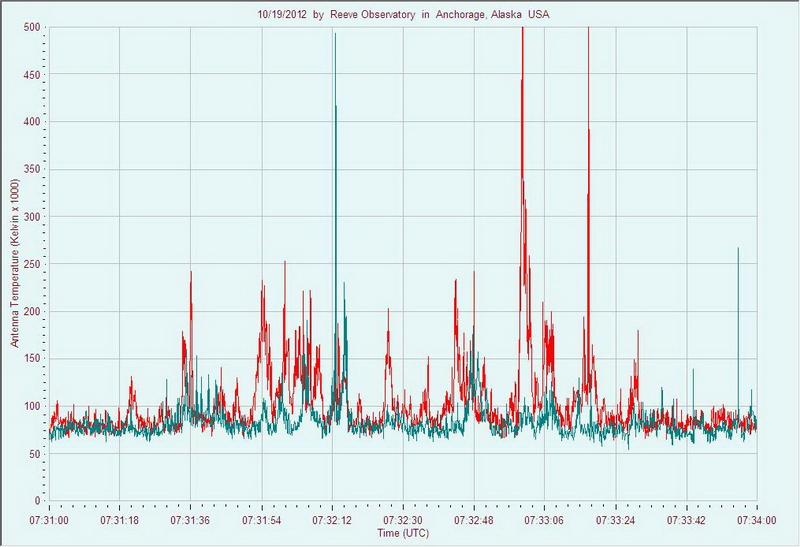
early-morning pass. We used two Icom R-75 HF
Receivers, one tuned to 19.432 MHz (LSB), corresponding to the Red trace in the charts below,
and the other tuned to 20.342 MHz (LSB), corresponding to the Green trace.
The receivers were connected to the antenna through a splitter (the splitter
also feeds an e-CALLISTO up-converter) and then a multicoupler. The multicopuler
feeds a total of four HF receivers. The antenna
was an 8-element log periodic antenna pointed at a fixed azimuth of 79 degrees true (no tracking
was used). The log periodic antenna has a design frequency range of 18 to 32
MHz.
This was an
early-morning pass. We used two Icom R-75 HF
Receivers, one tuned to 19.432 MHz (LSB), corresponding to the Red trace in the charts below,
and the other tuned to 20.342 MHz (LSB), corresponding to the Green trace.
The receivers were connected to the antenna through a splitter (the splitter
also feeds an e-CALLISTO up-converter) and then a multicoupler. The multicopuler
feeds a total of four HF receivers. The antenna
was an 8-element log periodic antenna pointed at a fixed azimuth of 79 degrees true (no tracking
was used). The log periodic antenna has a design frequency range of 18 to 32
MHz.
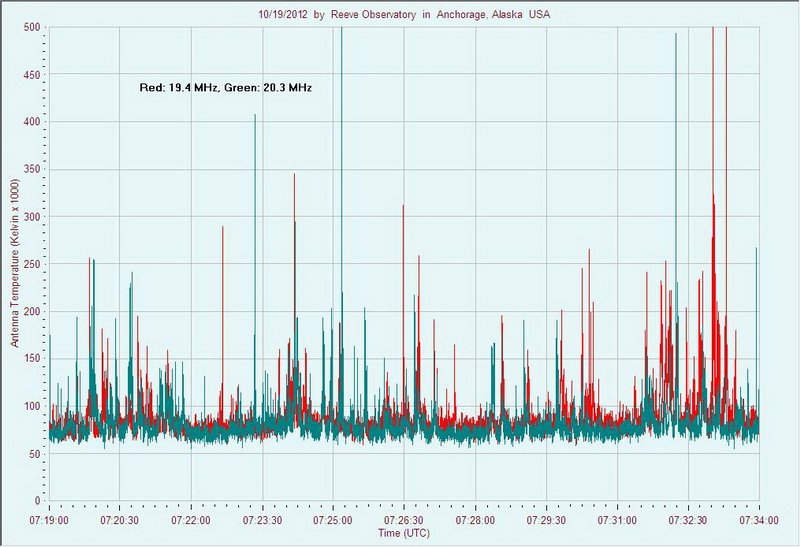
The predicted activity was an Io-B enhanced storm from 0655 to 0835. We detected a weak initial burst at 0701 followed by additional weak bursts reaching 3 dB above background noise between 0710 and 0712. The Jupiter storm intensity started to increase about 0718 and continued almost uninterrupted through 0737 with the most powerful bursts about 10 dB above background noise at the lower frequency. Almost no activity was detected after 0738.
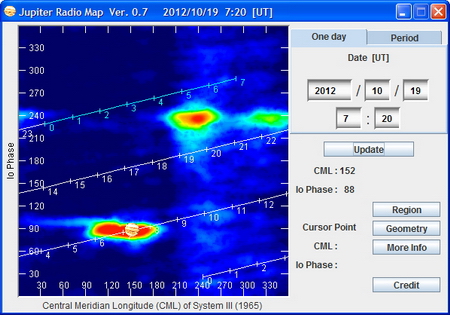
The Jupiter Radio Map is for reference and shows the orientation of the Io-B enhanced source at the observation time (lower-left of image). We observed mostly S-bursts but some sounded like fast L-bursts. The first chart below shows the time period 0719 through 0734, which covers most of the storm. Additional charts show shorter periods as indicated on the horizontal scales. Links to stereo sound files associated with selected burst periods are provided below the charts.
At the time of the charts Jupiter was at azimuth/elevation of approximately 79 degrees true and 19 degrees above the horizon. All times and dates are UTC.
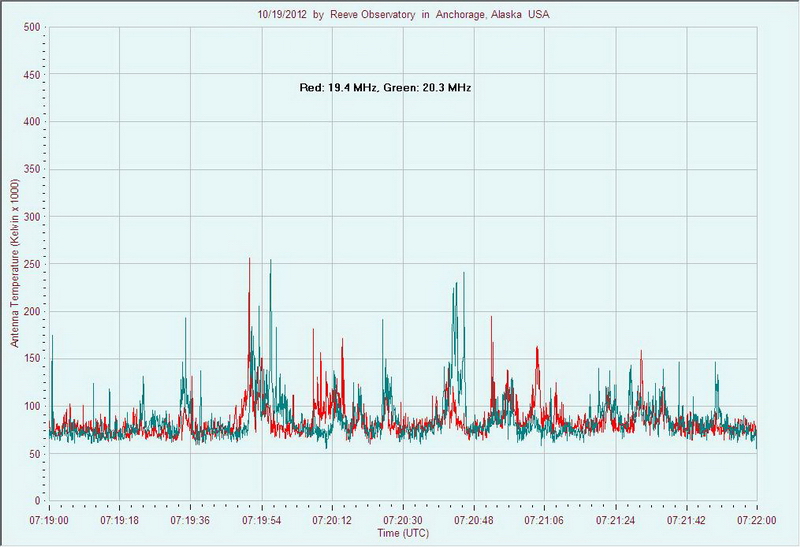
Click here for a stereo audio file corresponding to the time period 0719:45 to 0720:00
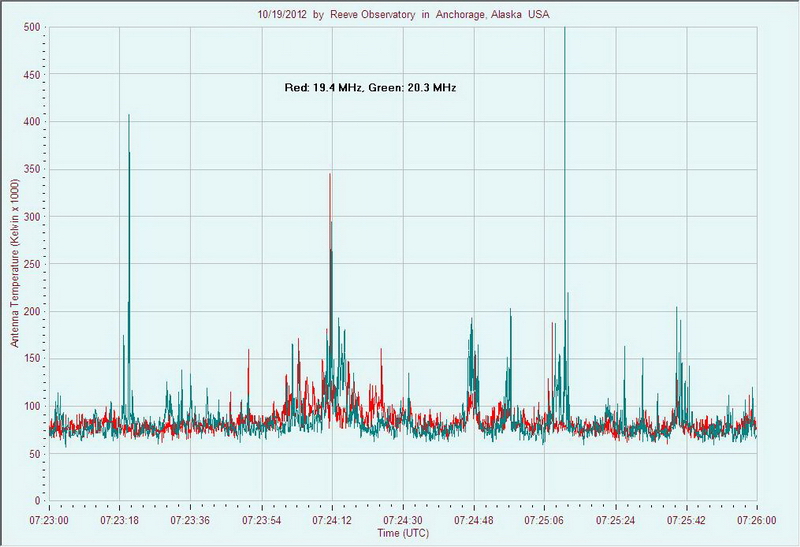
Click here for a stereo audio file corresponding to the time period 0724:00 to 0724:20
Click here for a stereo audio file corresponding to the time period 0731:50 to 0732:20
Click here for a stereo audio file corresponding to the time period 0732:57 to 0733:10