Solar Radio Observations at HF for 07 May 2012
Where needed, additional descriptive information is provided below the images. No audio is available for these charts.
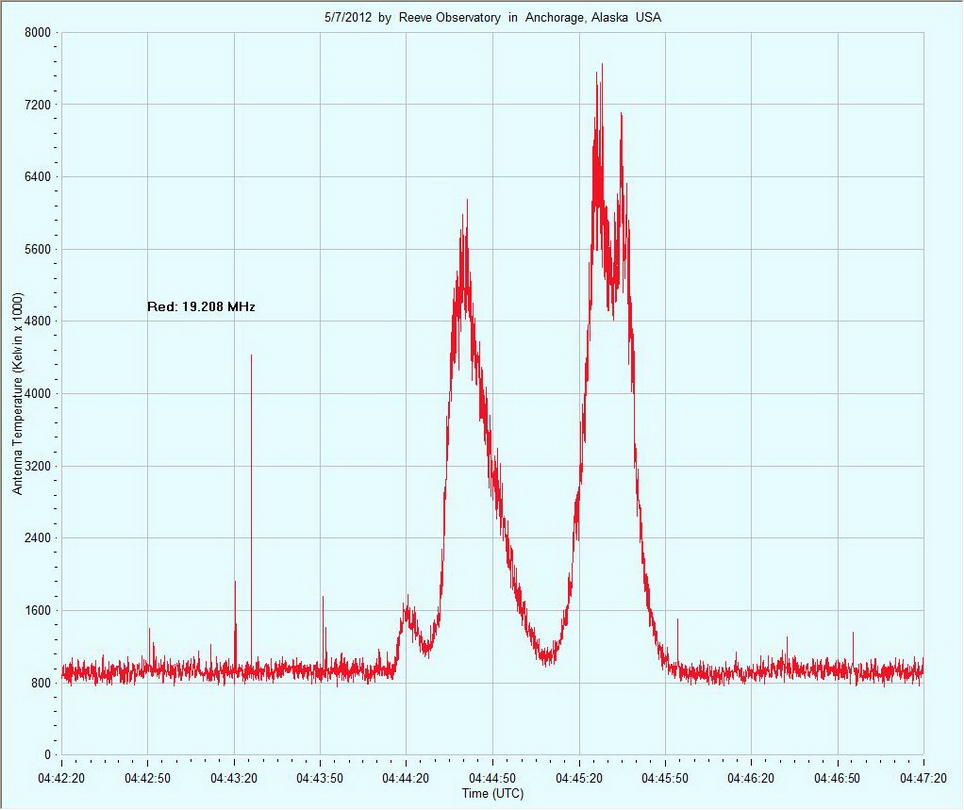
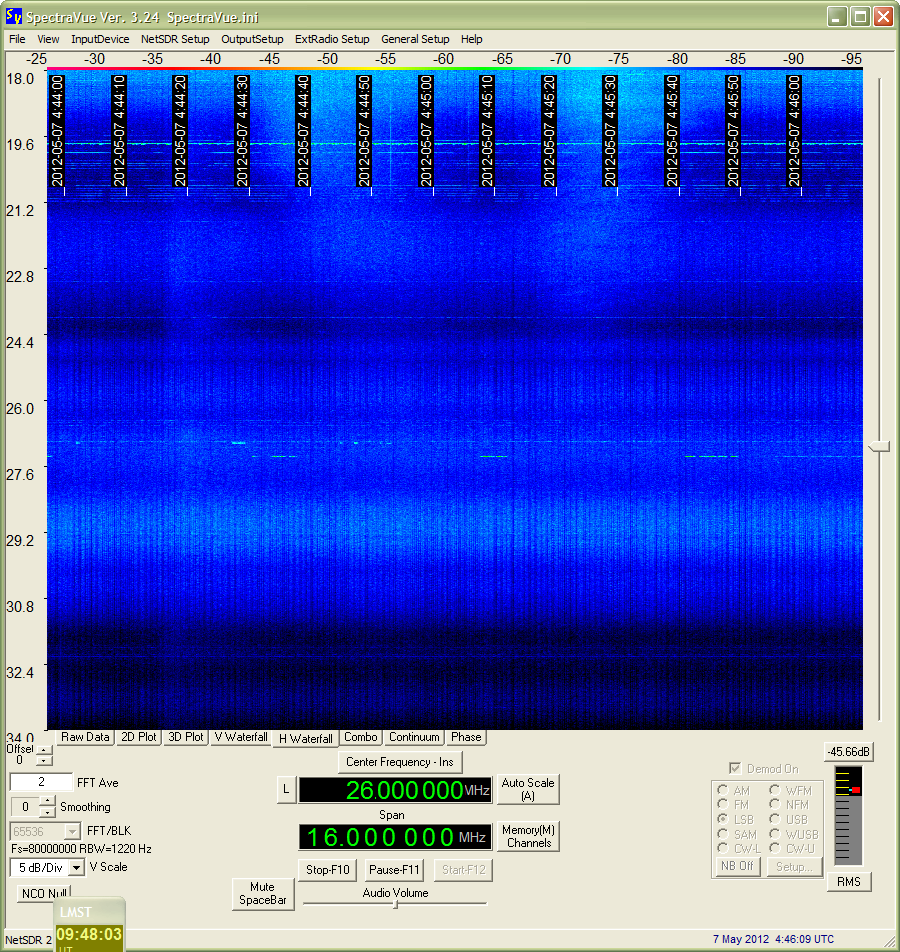
The chart above shows three peaks at 19.2 MHz. The spectrogram below for the same time period shows two puffy light areas at the top (18~19 MHz) preceded by a very light streak corresponding in time to the chart.
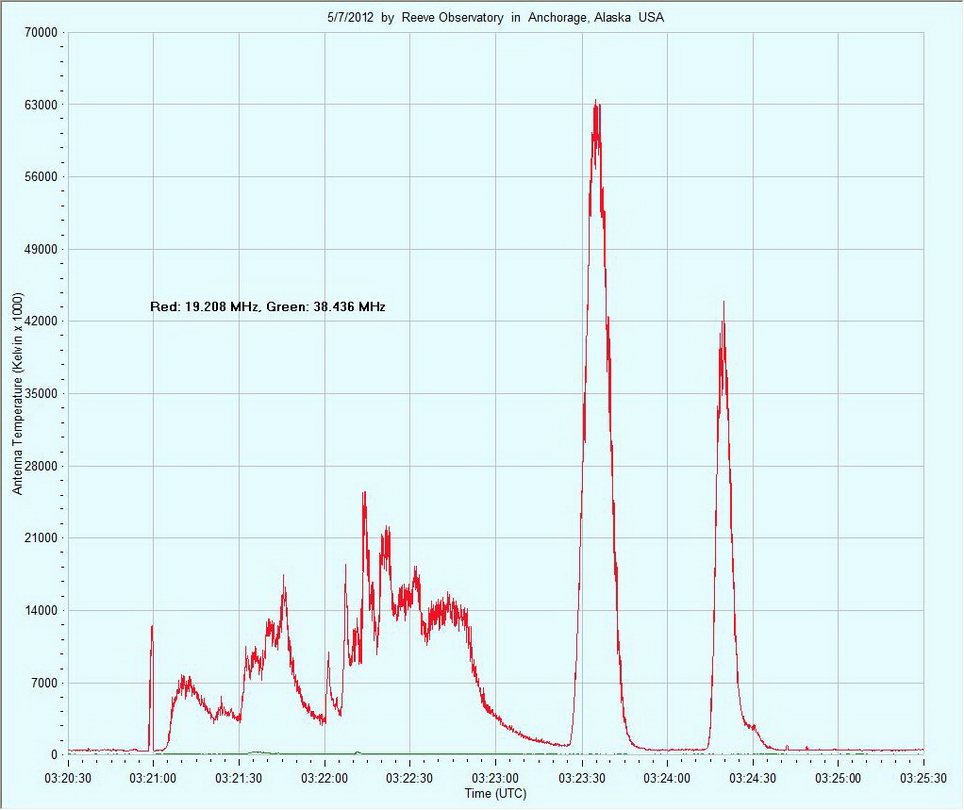
The solar burst shown above is fairly complex at 19.2 MHz but not discernible at 38.4 MHz. The peak antenna temperature at 19.2 MHz was 63 million K.
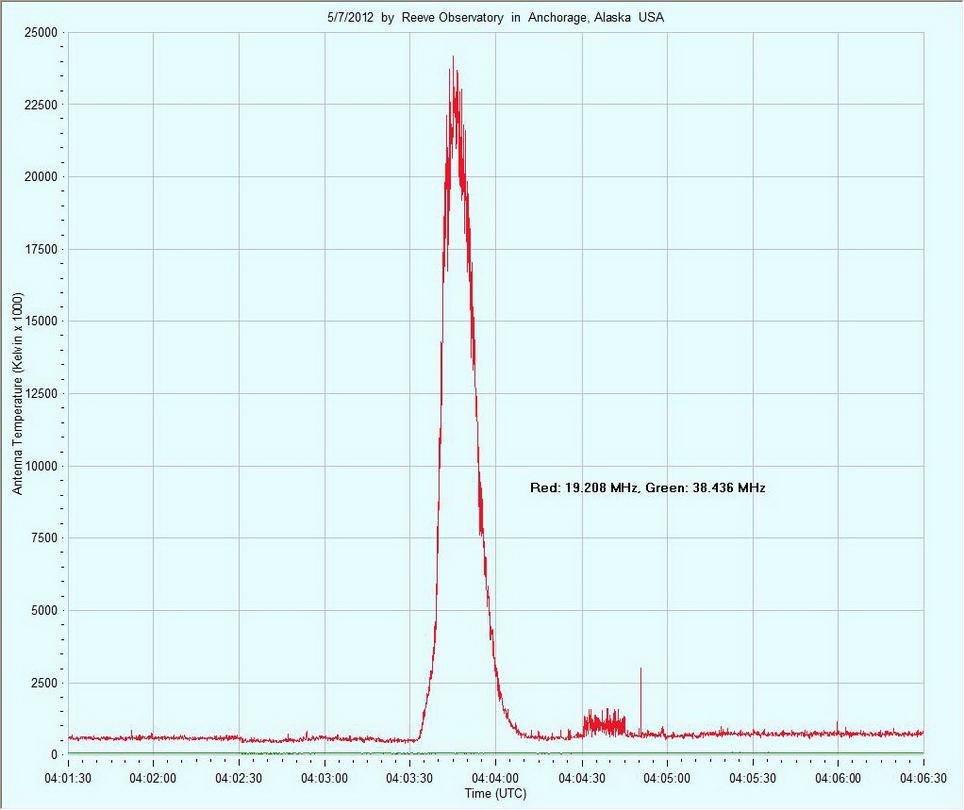
The strong solar burst shown above almost reached 25 million K at 19.2 MHz but was not discernible at 38.4 MHz. It was followed about 1/2 minute later by a relatively weak burst of radio frequency interference at 0404:30.
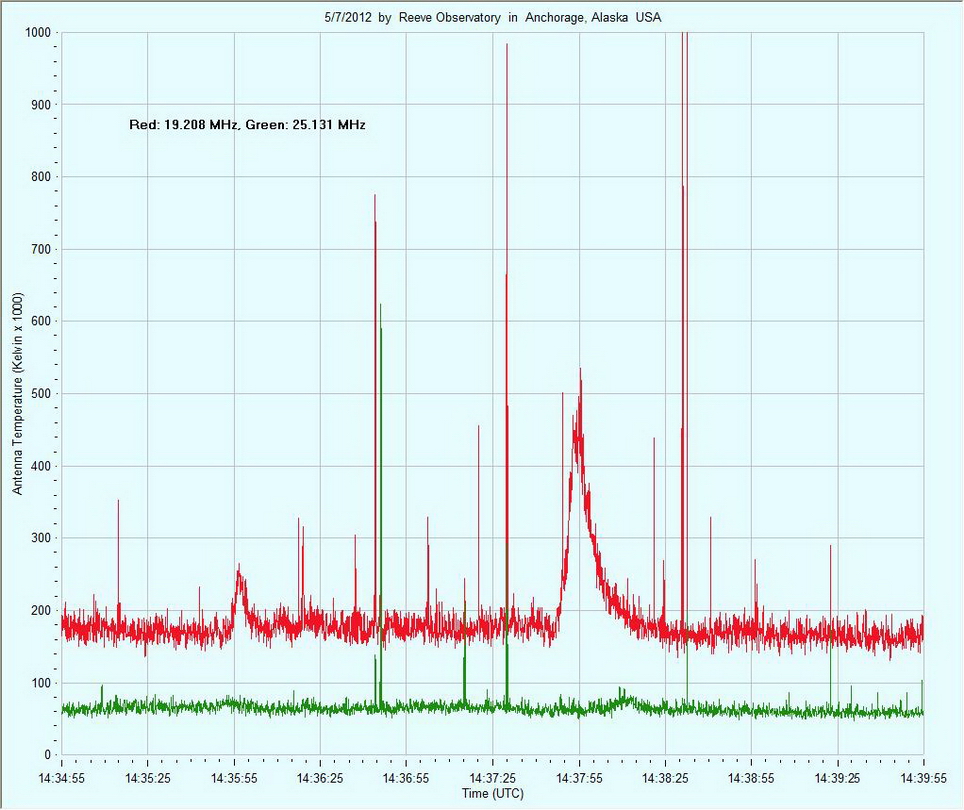
The chart above shows a two weak solar bursts, one at 1435:55 and another at 1437:55. The bursts are barely discernible at 25.1 MHz. The second burst appears to have a reverse frequency sweep with the lower frequency peak before the higher frequency.