Solar Radio Observations at HF for 11 May 2012
Where needed, additional descriptive information is provided below the images. No audio is available for these charts.
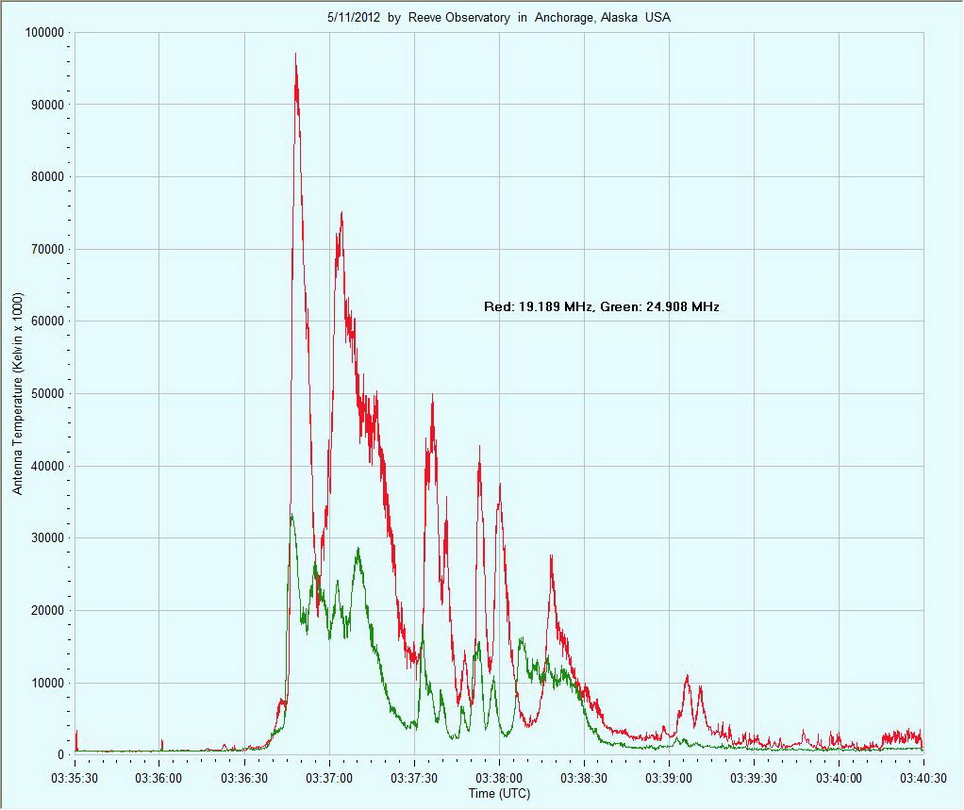
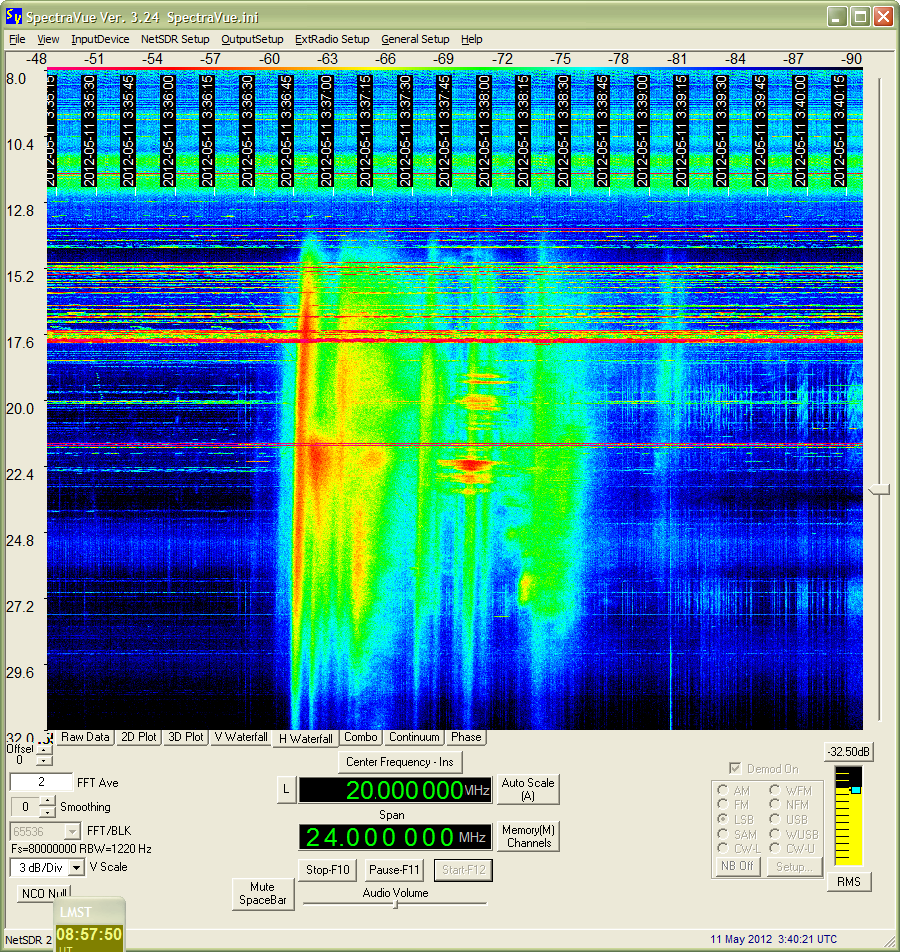
The complexity of the solar burst shown in the above chart also is readily apparent in the accompanying spectrogram immediately below. The burst reached almost 100 million K at 19.2 MHz and is the most powerful recorded at this observatory. The spectrogram is marred by bands of radio frequency interference.
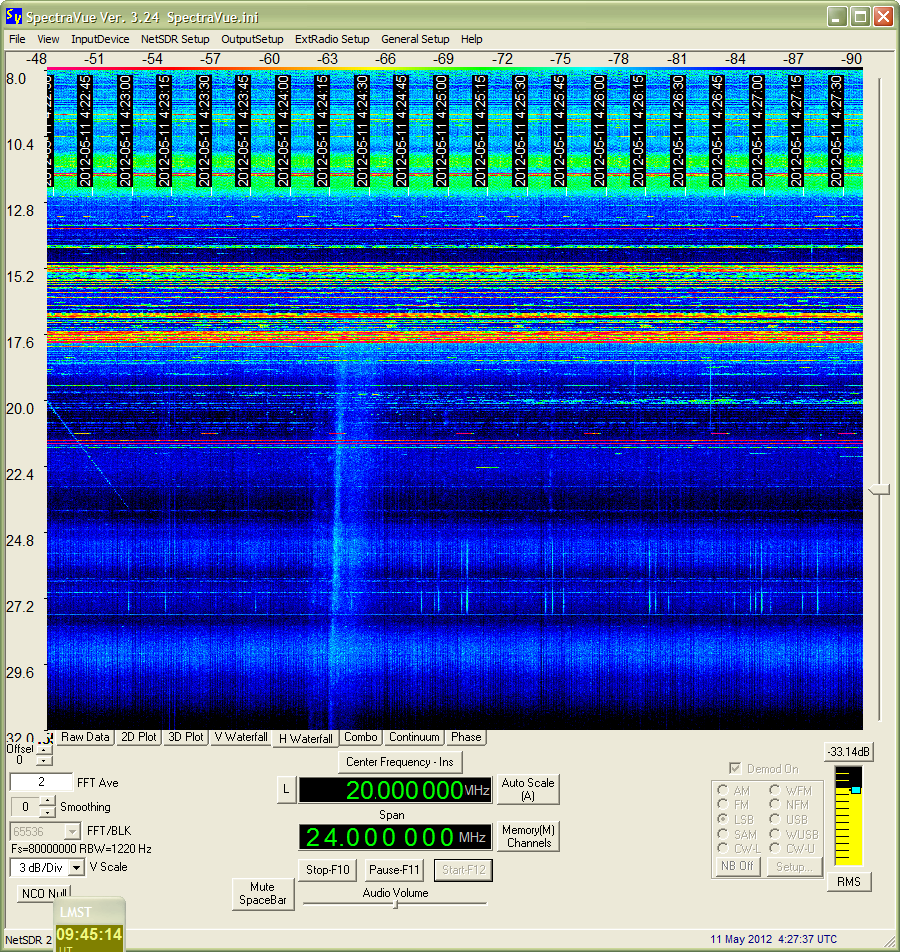
The spectrogram above shows a solar burst at 0424:15 among RFI.
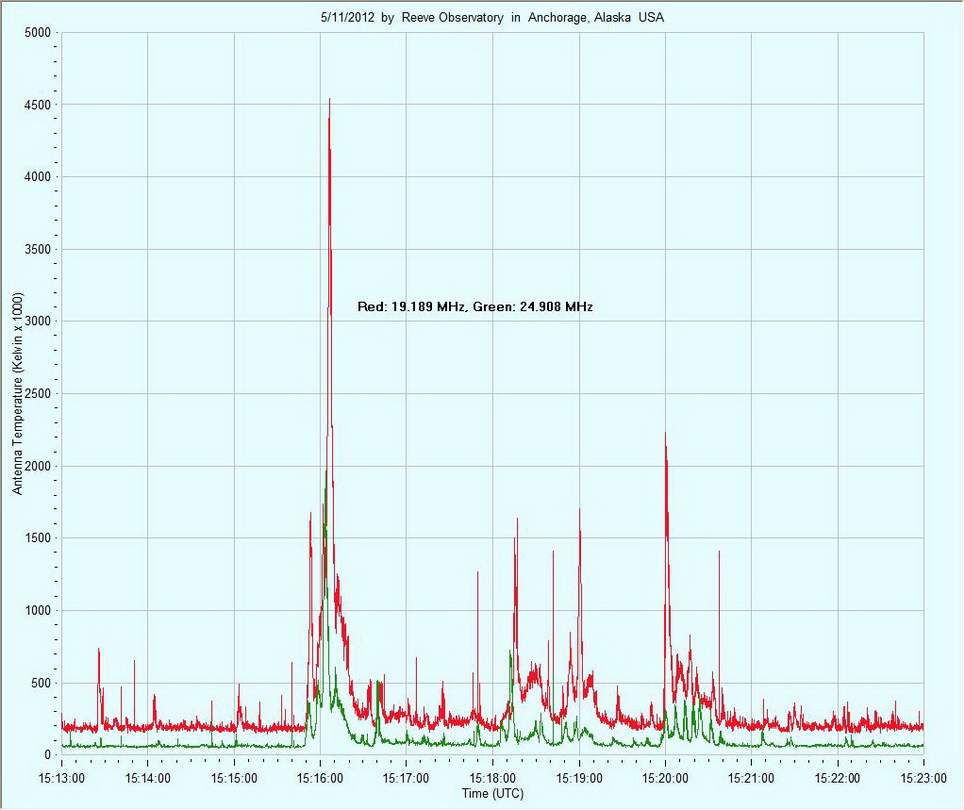
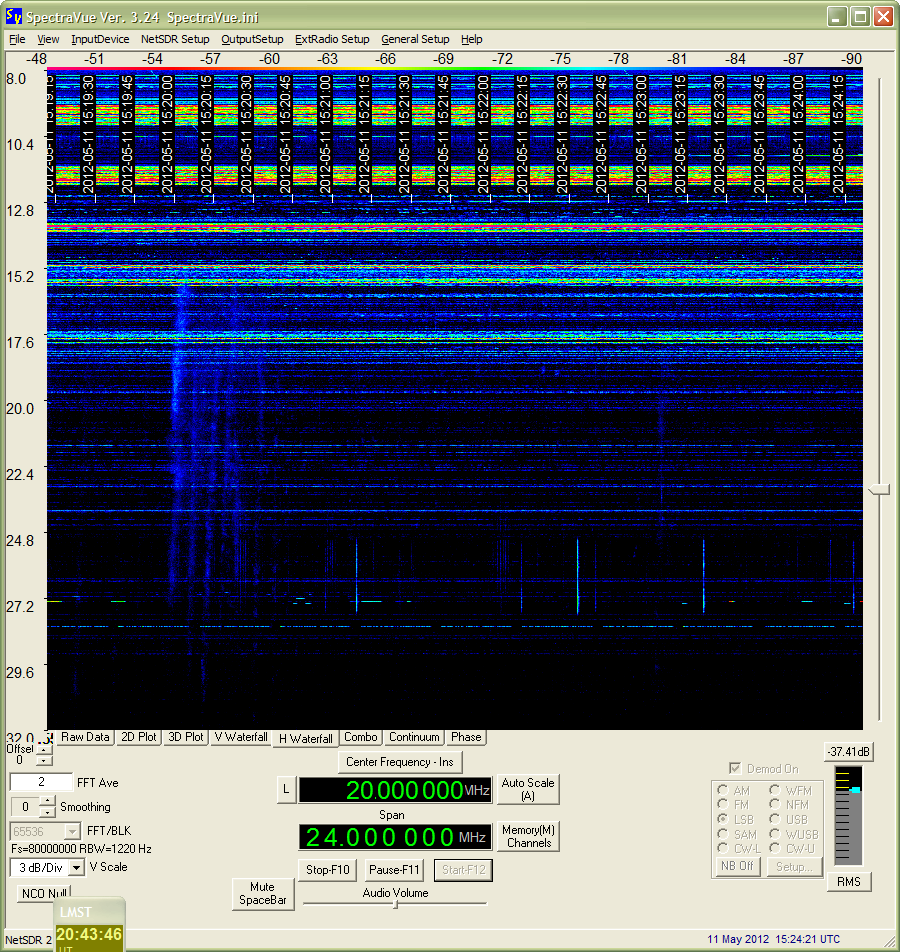
The above chart shows a series of solar bursts from 1516 to 1522 and the accompanying spectrogram immediately below shows the bursts at 1520 corresponding to the series of six or seven spikes on the chart at that time.
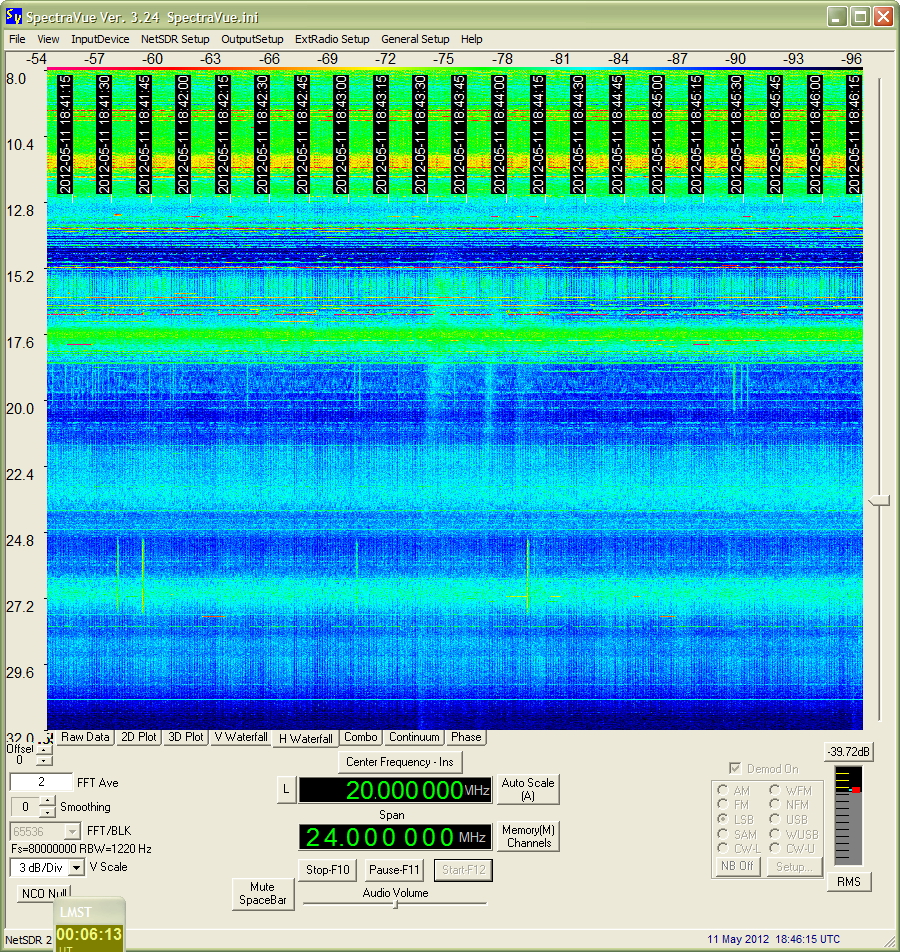
The above spectrogram shows a series of weak solar bursts at 1843:30.