Solar Radio Observations at HF for 18 May 2012
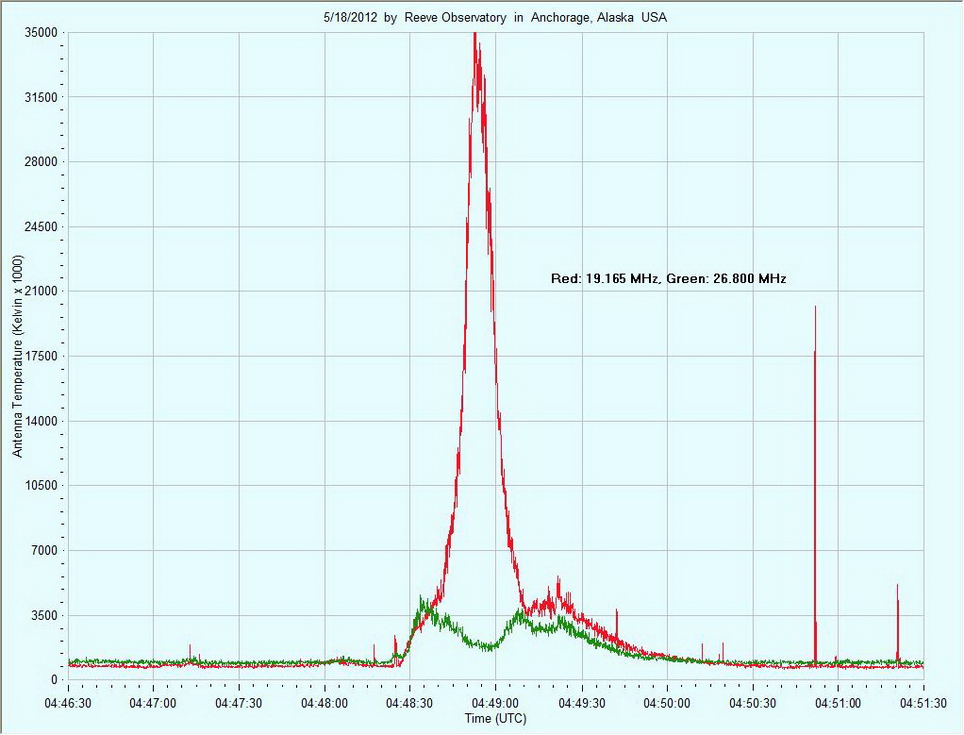
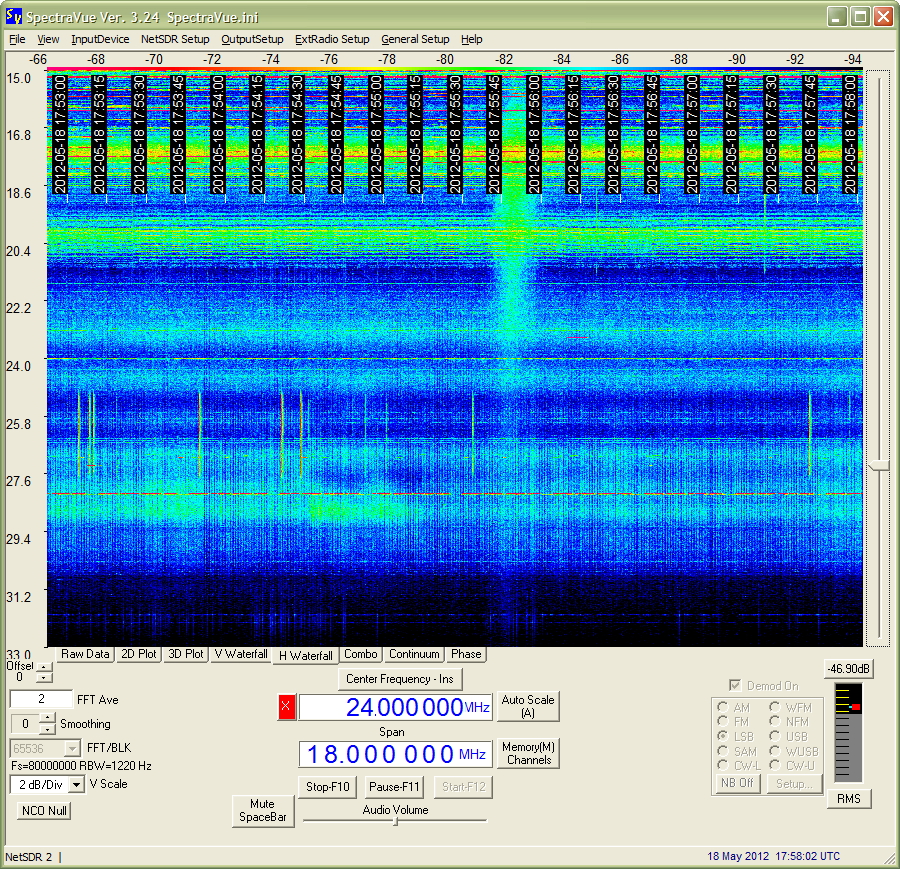
The solar burst in the chart above does not appear to have many interesting features but the accompanying spectrogram immediately below shows more detail. By coincidence the peak energy as seen in the spectrogram occurred at the same frequency as one of the fixed frequency receivers recorded on the chart at 19.2 MHz.
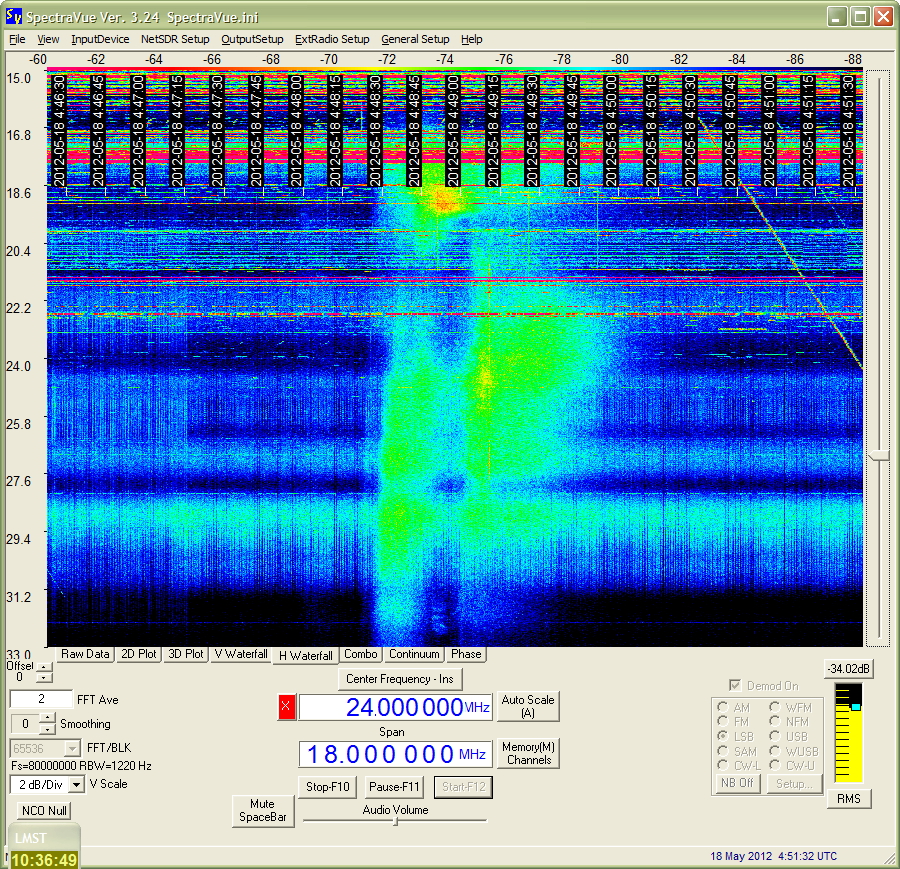
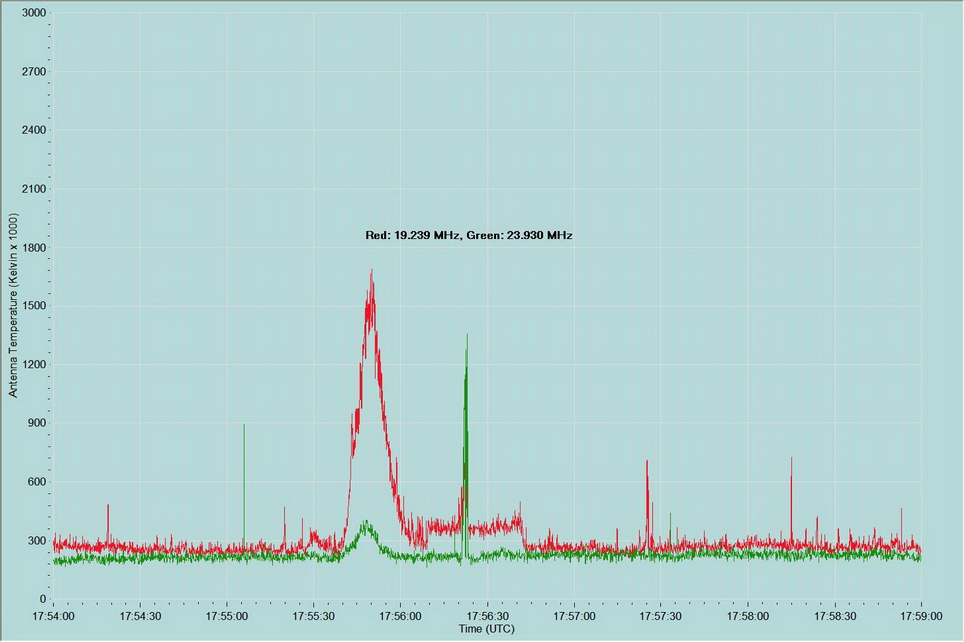
The chart above and accompanying spectrogram immediately below shows a fairly typical burst. Click on the chart to listen to an audio recording. There is a sharp burst of RFI indicated on the chart immediately following the solar burst. Also, the chart indicates a shelf at 19.2 MHz following the solar activity, cause unknown.