Solar Radio Observations at HF on 08 May 2012
Where needed, additional descriptive information is provided below the images. No audio is available for these charts.
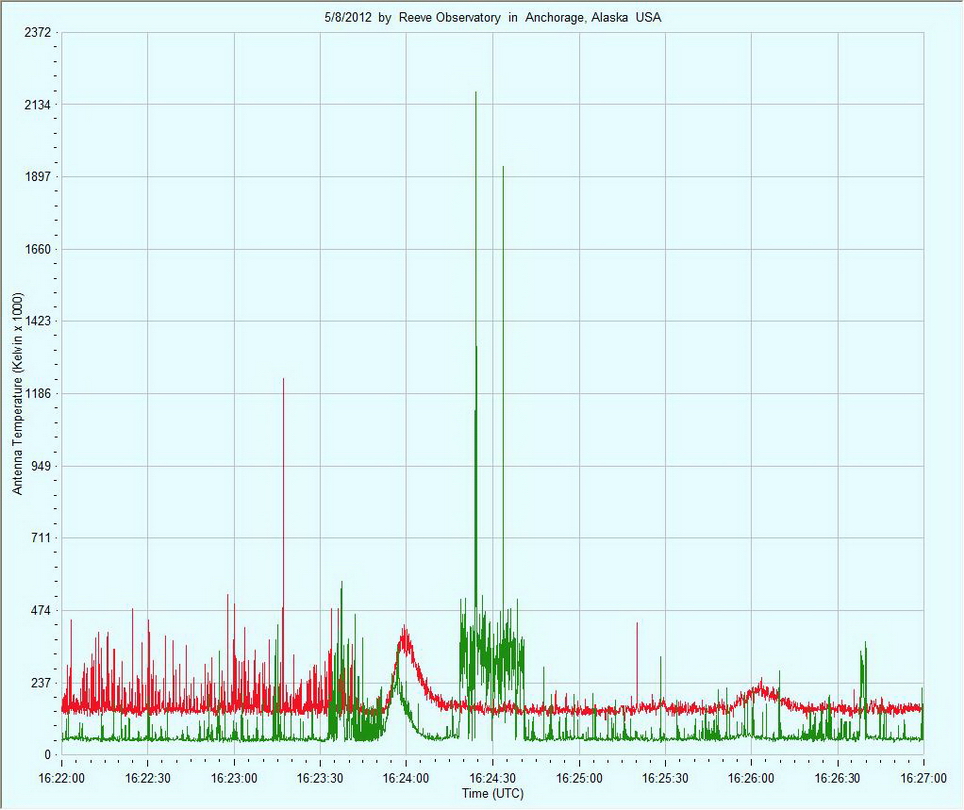
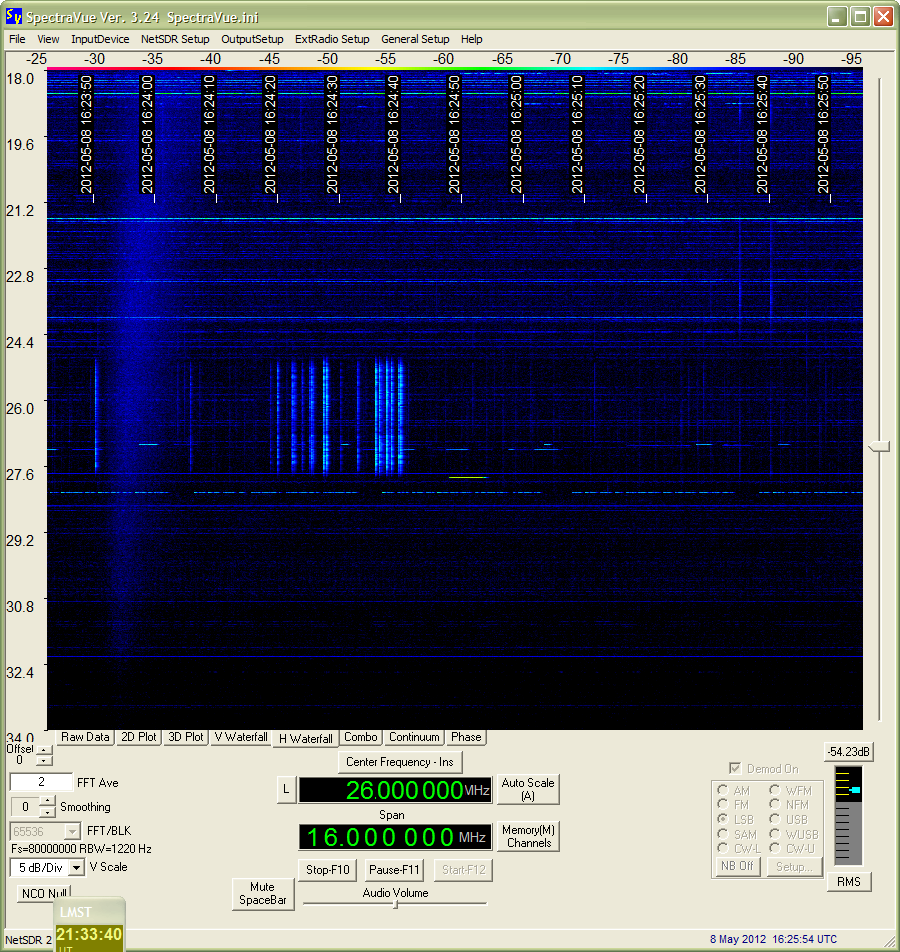
The chart above clearly shows the frequency sweep nature of many solar bursts, with the higher frequency peaking before the lower frequency. In this case, the frequency was not recorded but the red trace most probably is near 19 MHz and the green trace is near 24 MHz. Note that the red trace shows considerable relative radio frequency interference before the burst but then is quiet afterwards. The green trace is noisy on both sides and is followed by a burst of RFI at 1624:30. The spectrogram immediately below corresponds to the same time period as the chart above. The weak puffy streak on the left side of the spectrogram is the solar burst and the vertical and horizontal streaks are RFI.
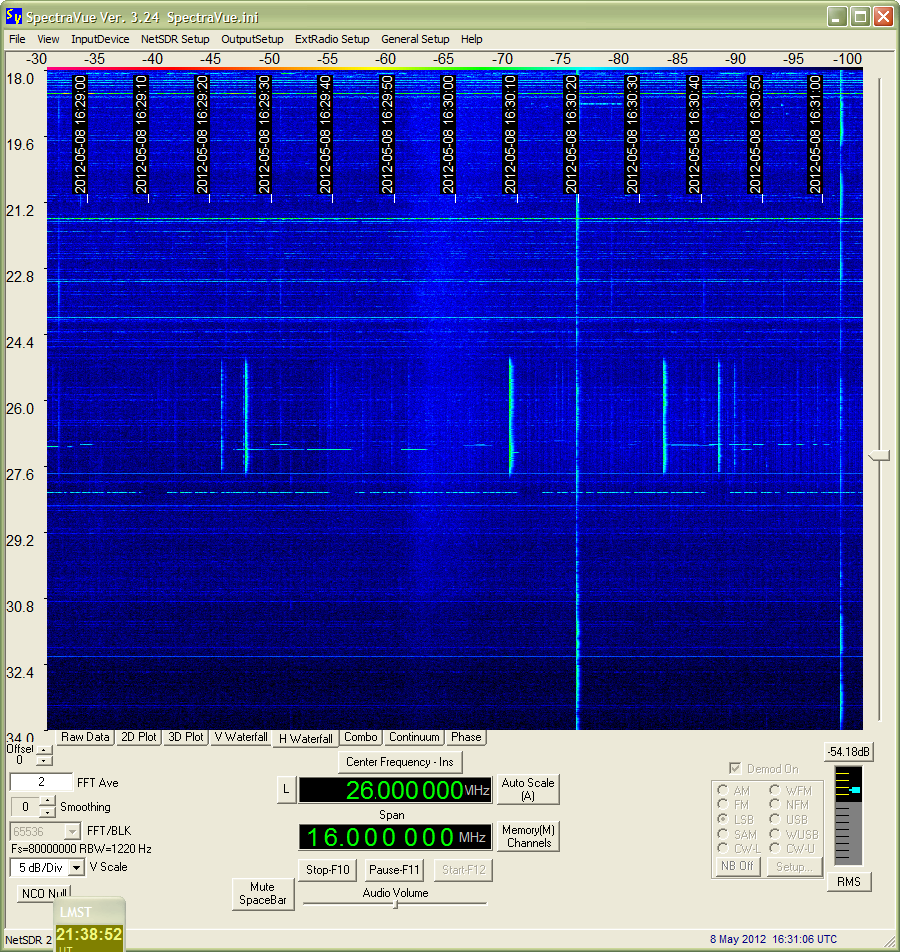
A weak solar burst can be seen in the above spectrogram at 1630:00 as a slanted puffy streak. The vertical and horizontal stripes are RFI.

The slanted puffy streak at about 1920:50 is a Type III (fast sweep) solar burst.