Solar Radio Observations at HF for 26 May 2012
Where needed, additional descriptive information is provided below the images. No audio is available for these charts.
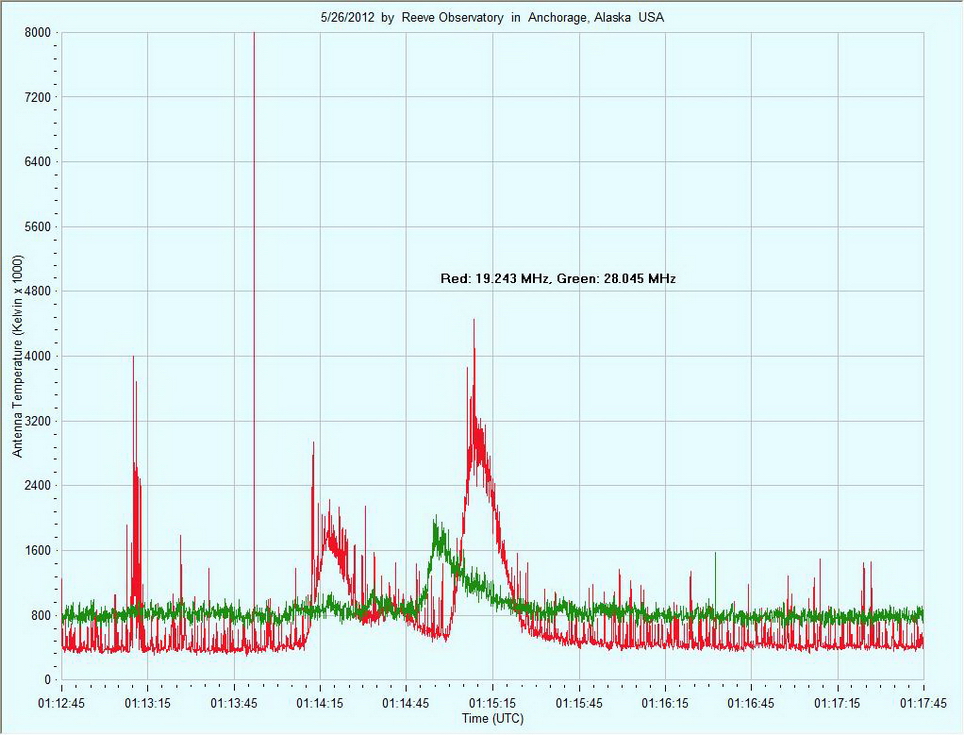
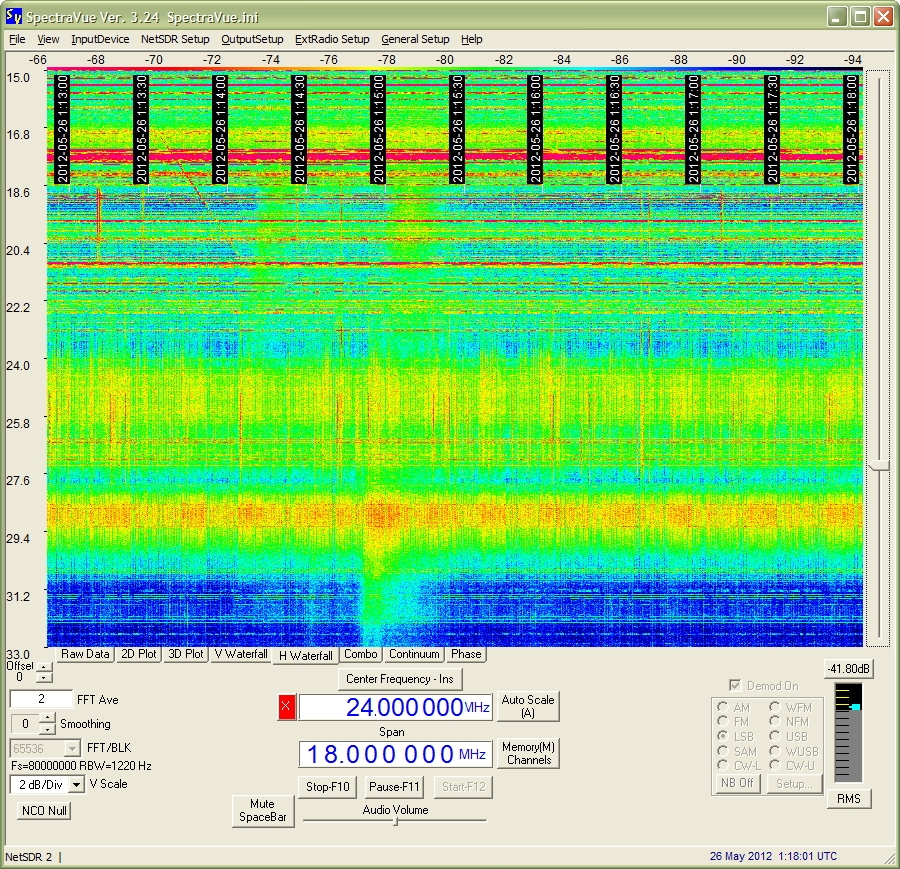
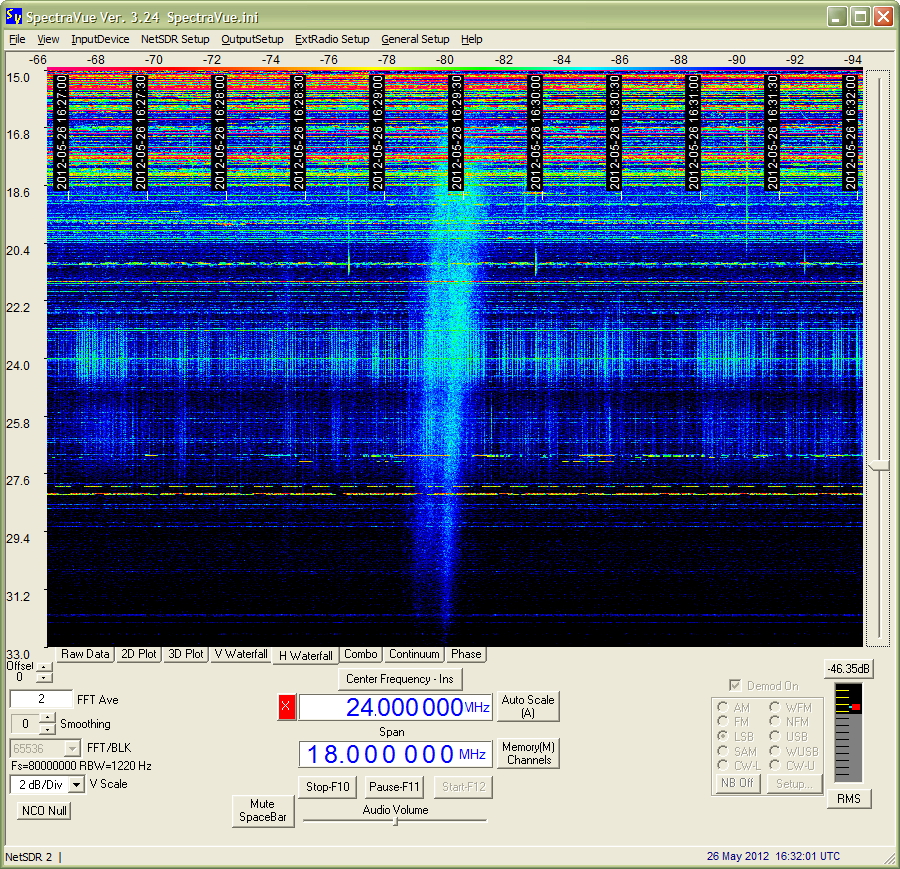
The above chart and accompanying spectrogram immediately below show what appear to be two separate solar bursts. The first one at 0114:15 indicated at 19.2 MHz but not at 28.0 MHz. The second burst indicated first at 28.0 MHz (green trace) followed by 19.2 MHz. Although the spectrogram is of low quality due to high levels of radio frequency interference and incorrect sensitivity setting, the two bursts are discernible.
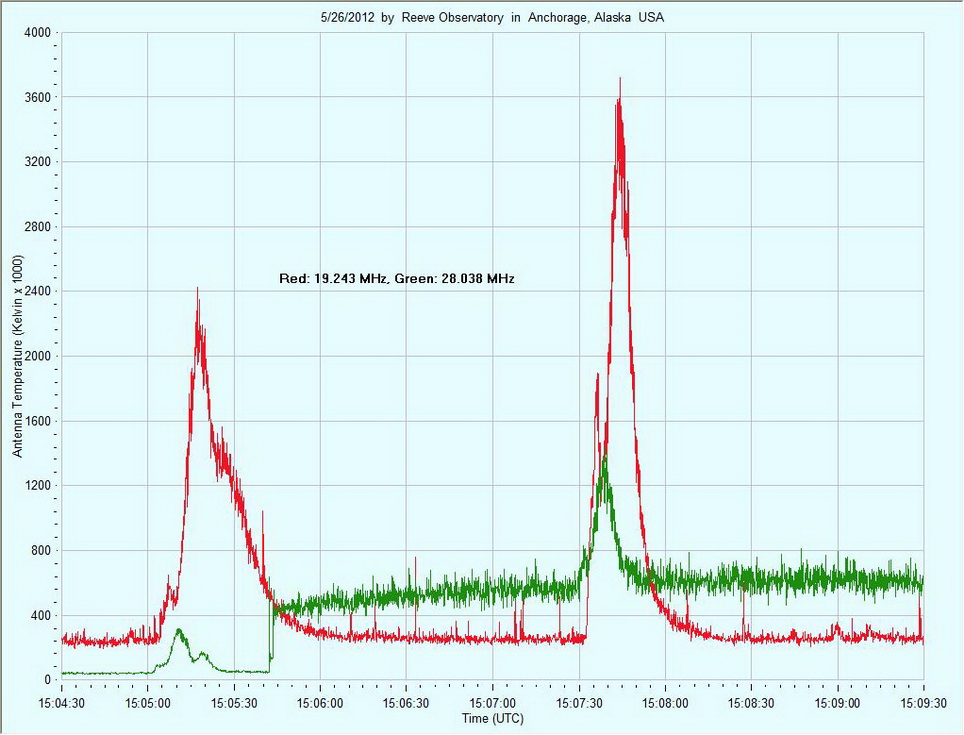
Two solar bursts are indicated in the chart above. The step-change in the green trace (28.0 Mhz) was most likely caused by a long burst of radio frequency interference.
The weak solar bursts shown in the chart above clearly show the sweep nature with the higher frequency peaking before the lower frequency.
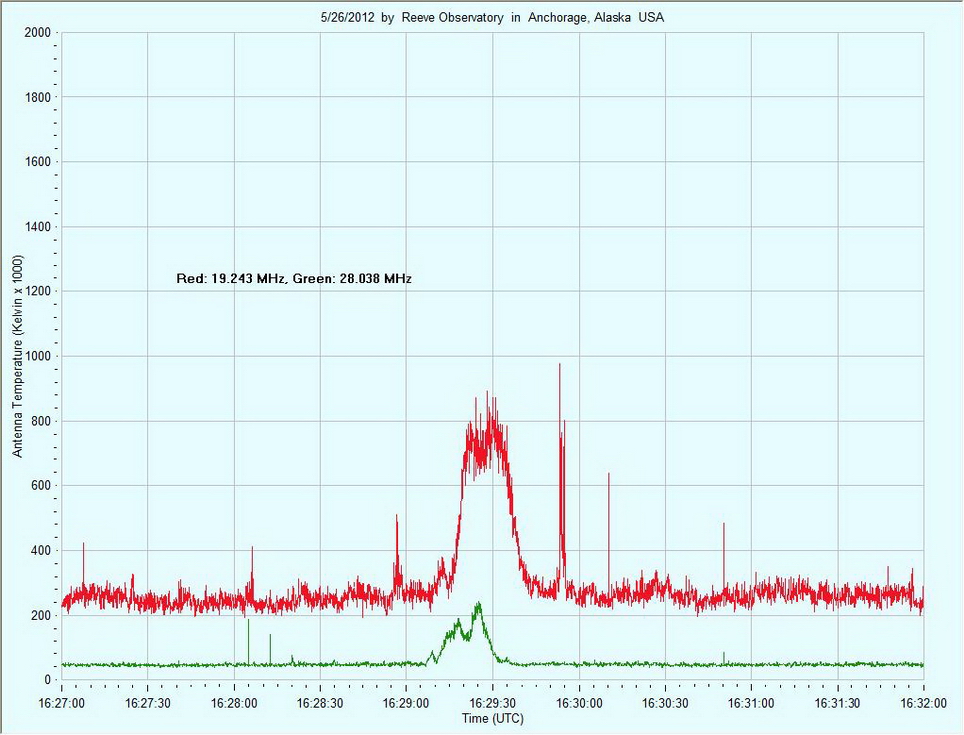
The solar burst shown in the chart above shows a little complexity with additional detail seen in the accompanying spectrogram below.
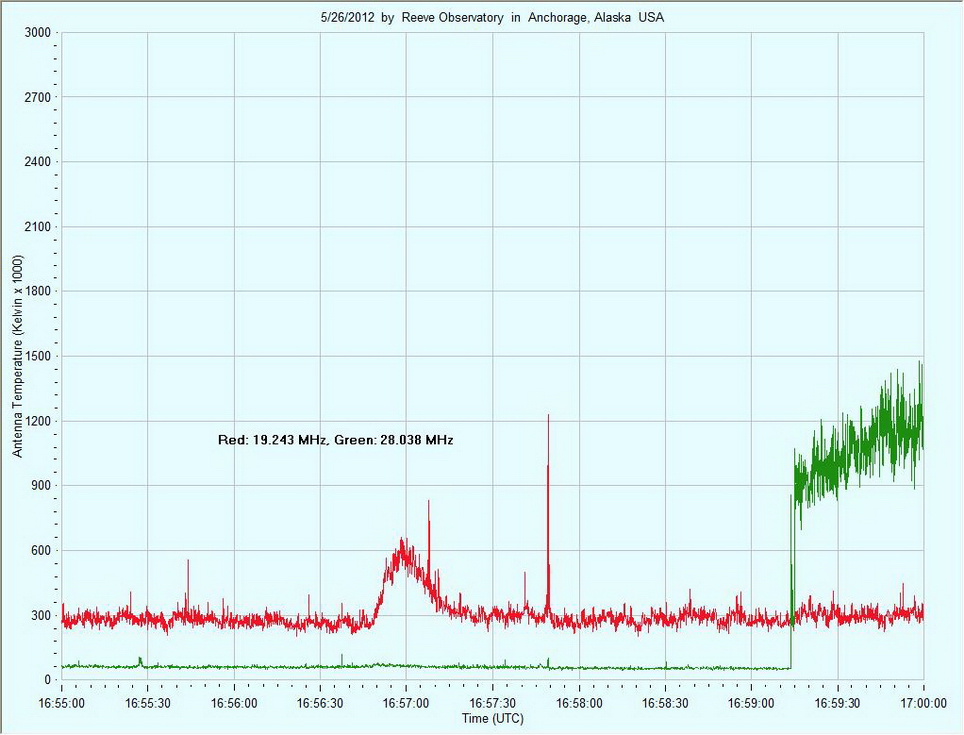
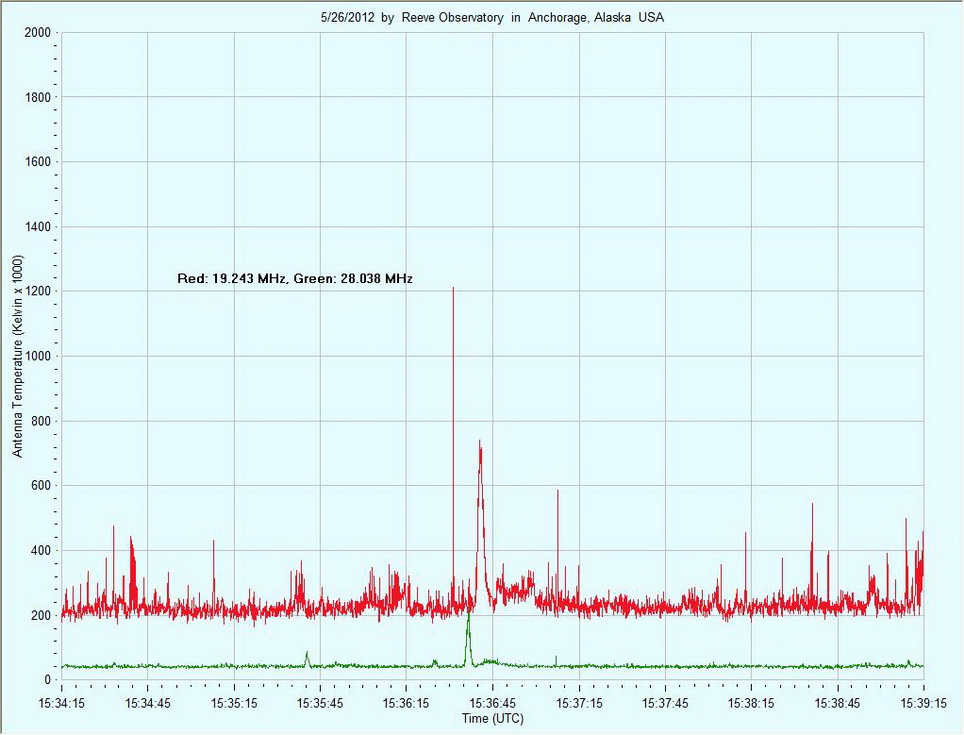
The weak solar burst at 1657 shown in the above chart was indicated at 19.2 MHz but not at 28.0 MHz. The step-change in the green trace at 1659 most likely is radio frequency interference.