Solar Radio Observations at HF for 10 May 2012
Charts and spectrograms are shown in chronological order with the chart shown first followed immediately by a corresponding spectrogram when available. Audio is available for some of the events on this page.
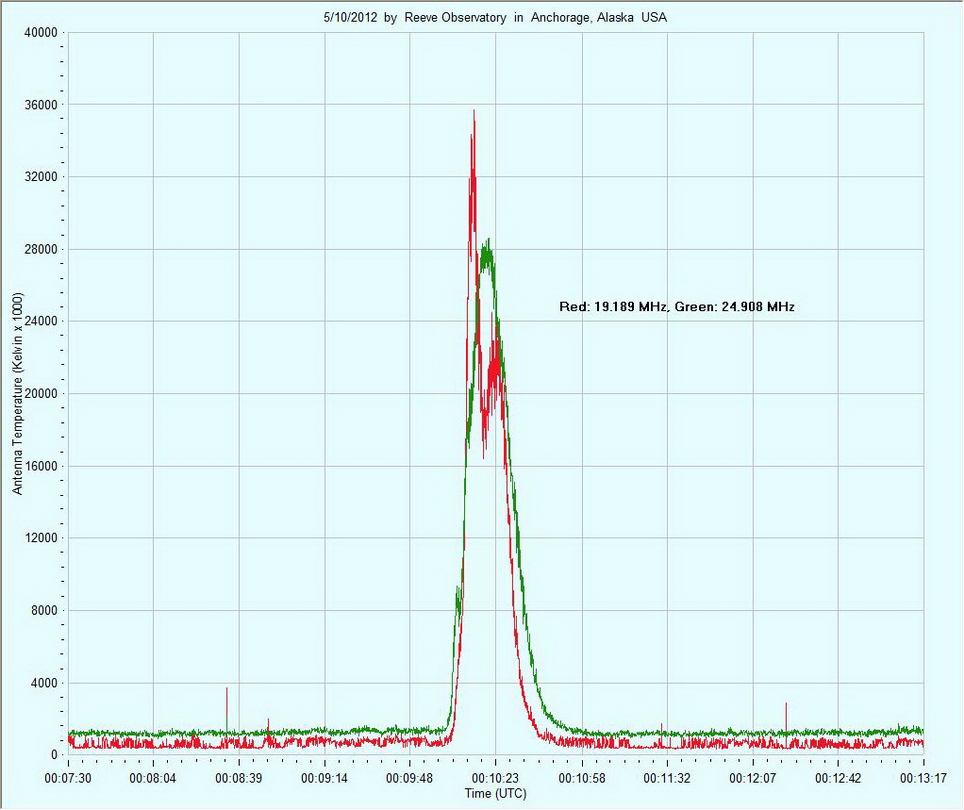
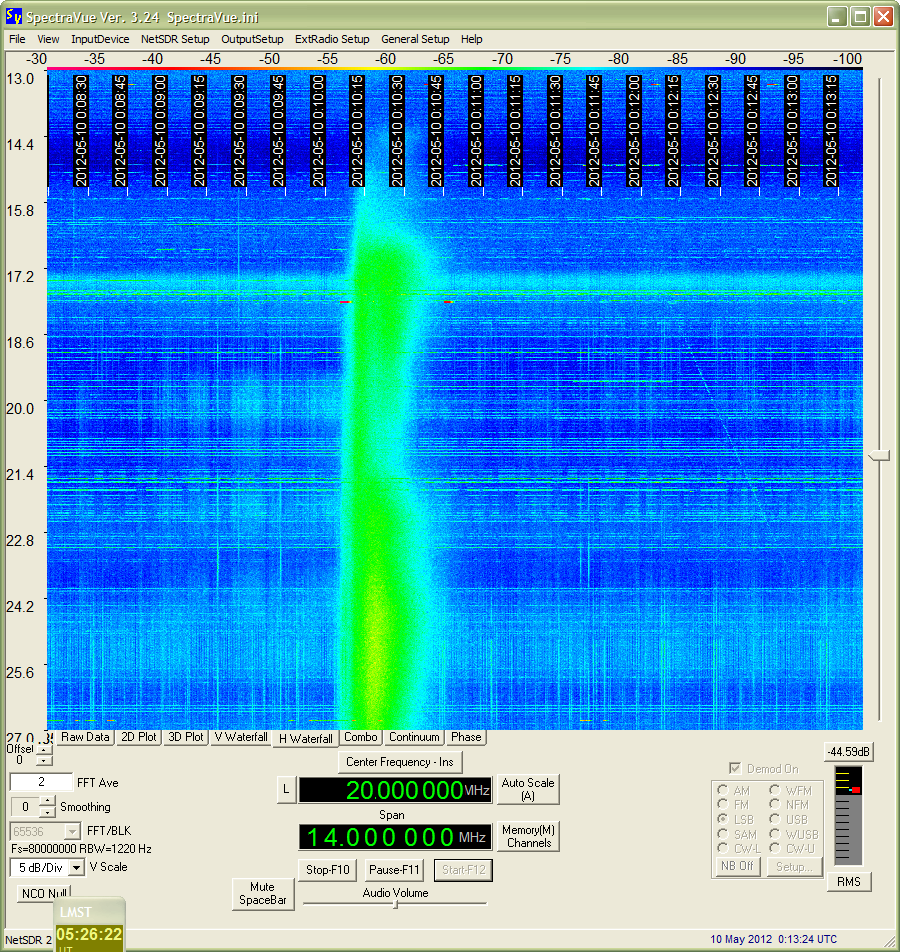
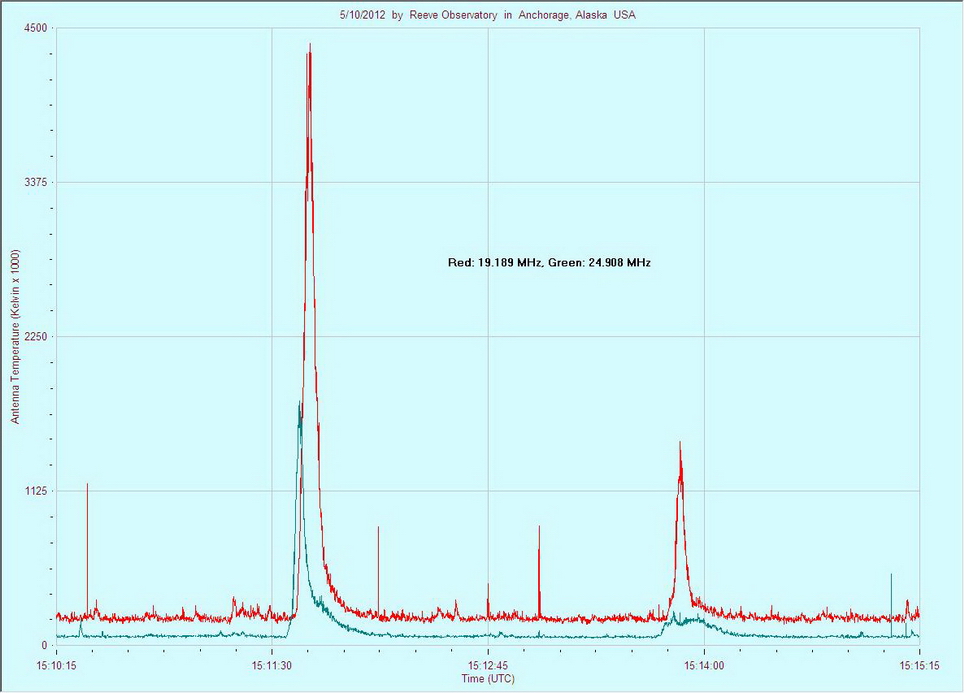
The solar burst shown in the chart above and spectrogram immediately below occurred early in the UTC day at 0010. The chart shows that the 36 million kelvin burst peak at 19.2 MHz was slightly higher than at 24.9 MHz. However, the spectrogram indicates the higher frequencies had higher power.
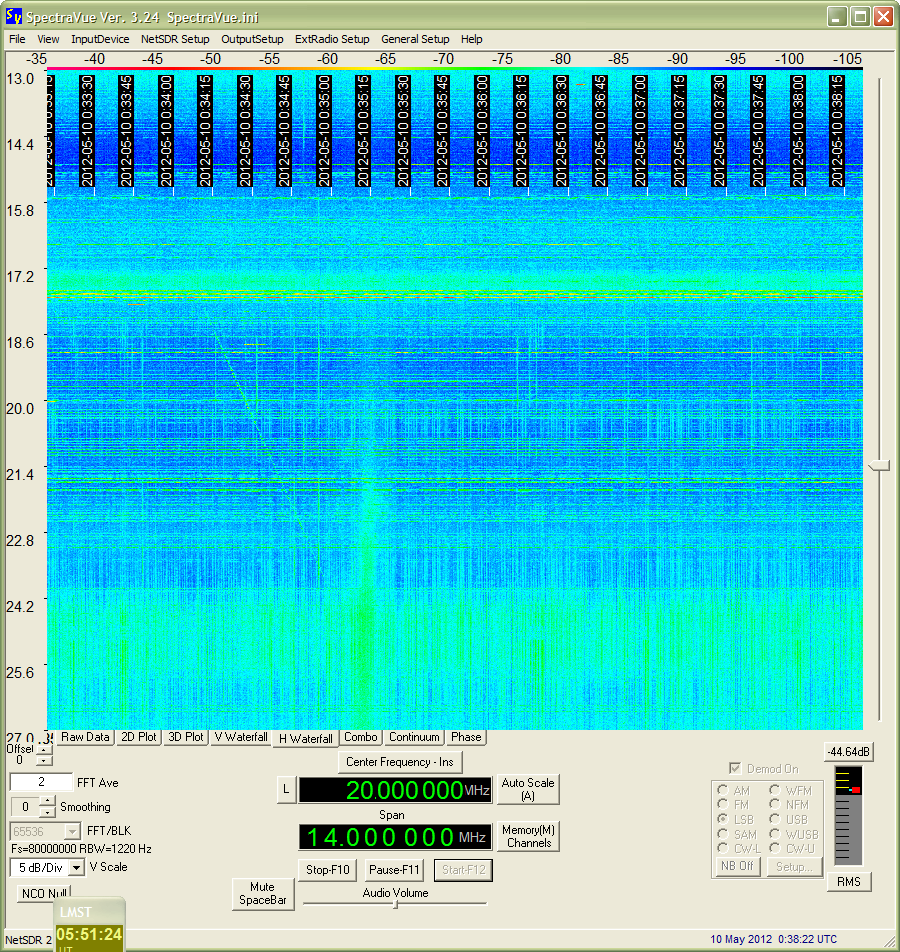
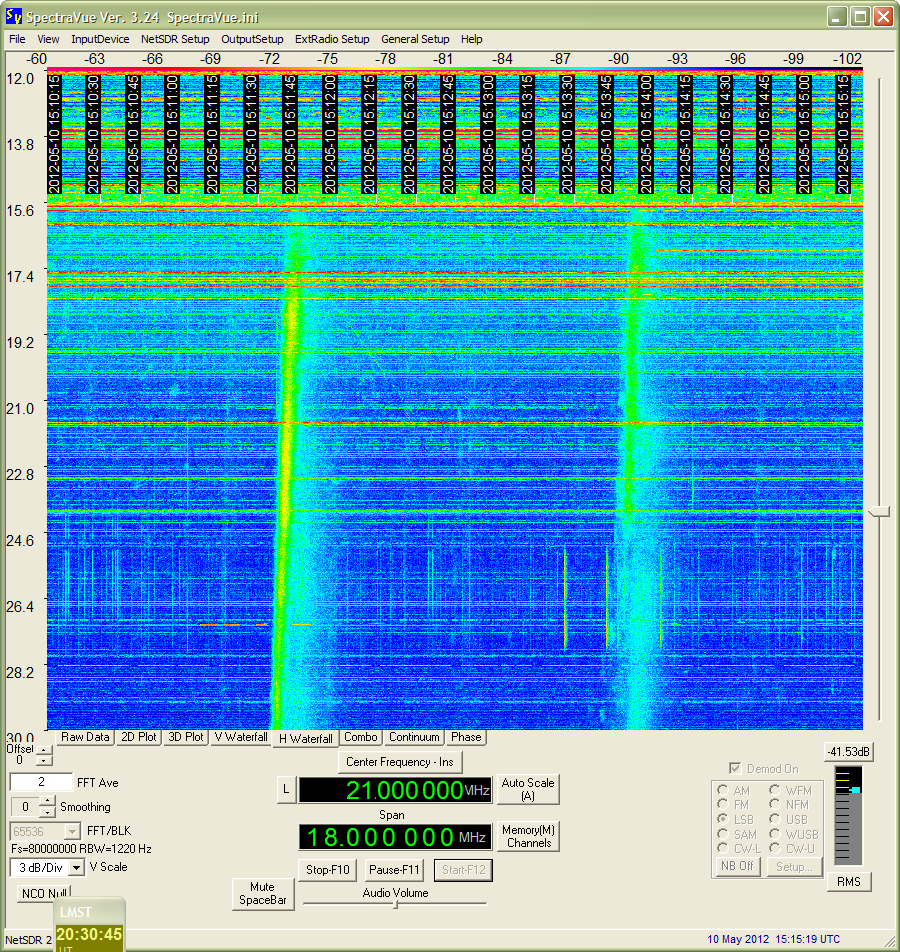
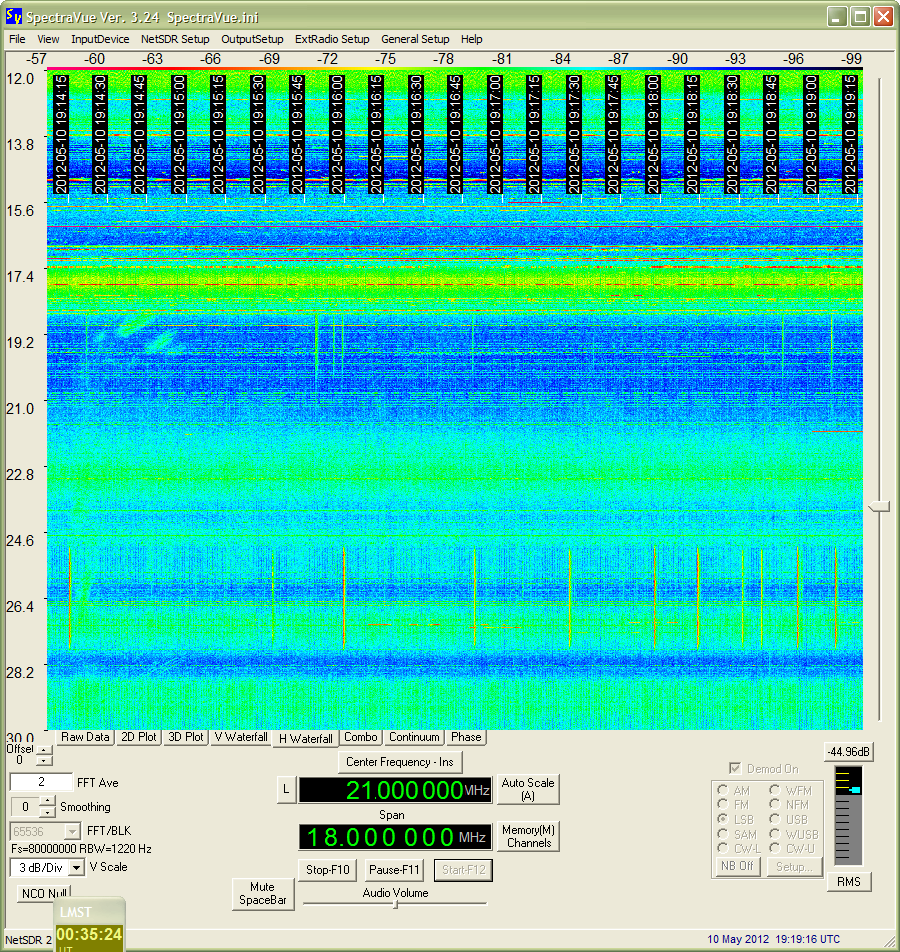
The weak burst shown above at 0035:15 occurred among large amounts of radio frequency interference and covered a range of around 20 to 27 MHz.
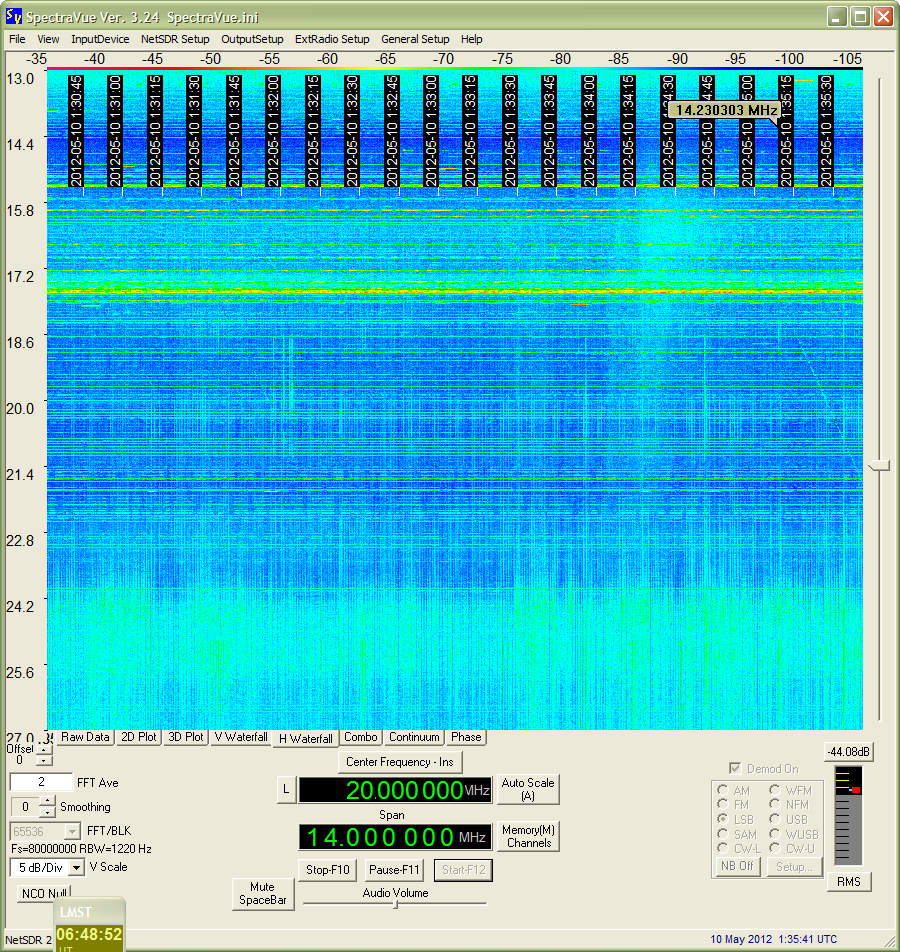
A weak puffy solar burst can be seen at 0134:30 in the above spectrogram.
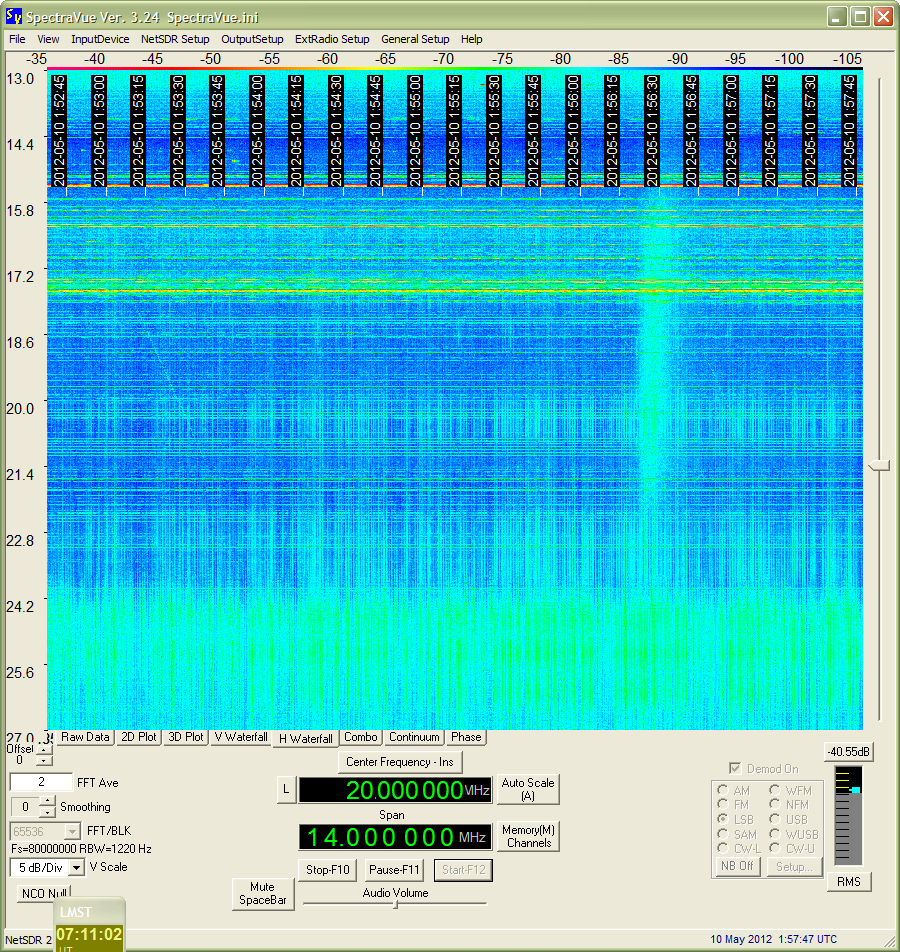
A weak solar burst can be seen at around 0156:30 in the above spectrogram.
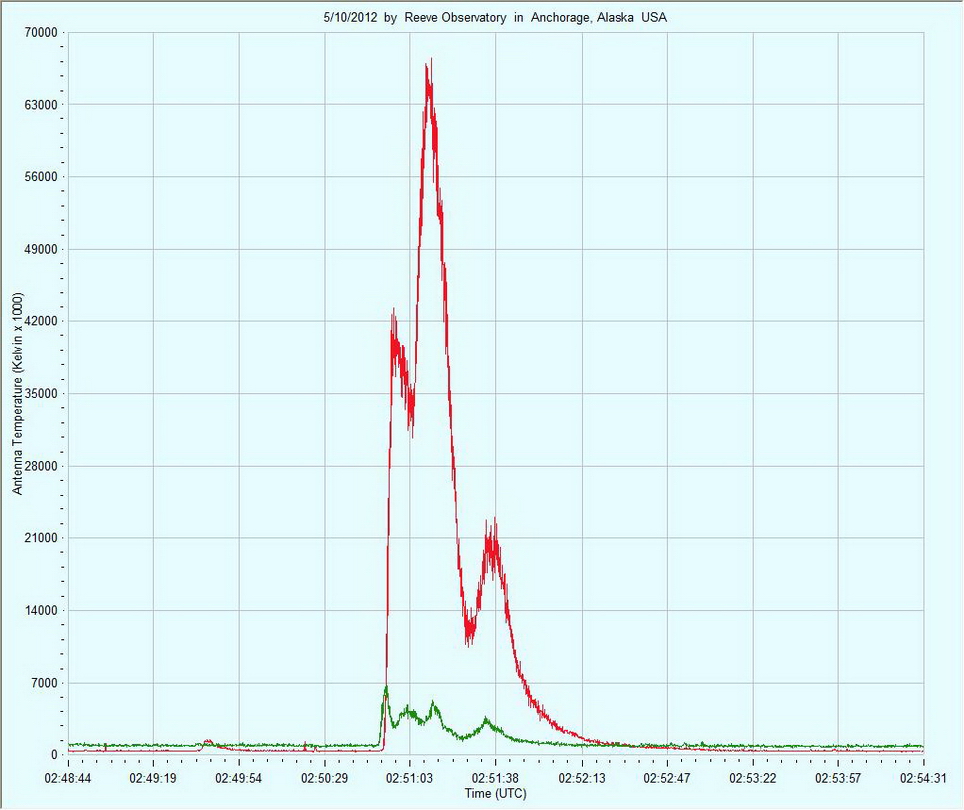
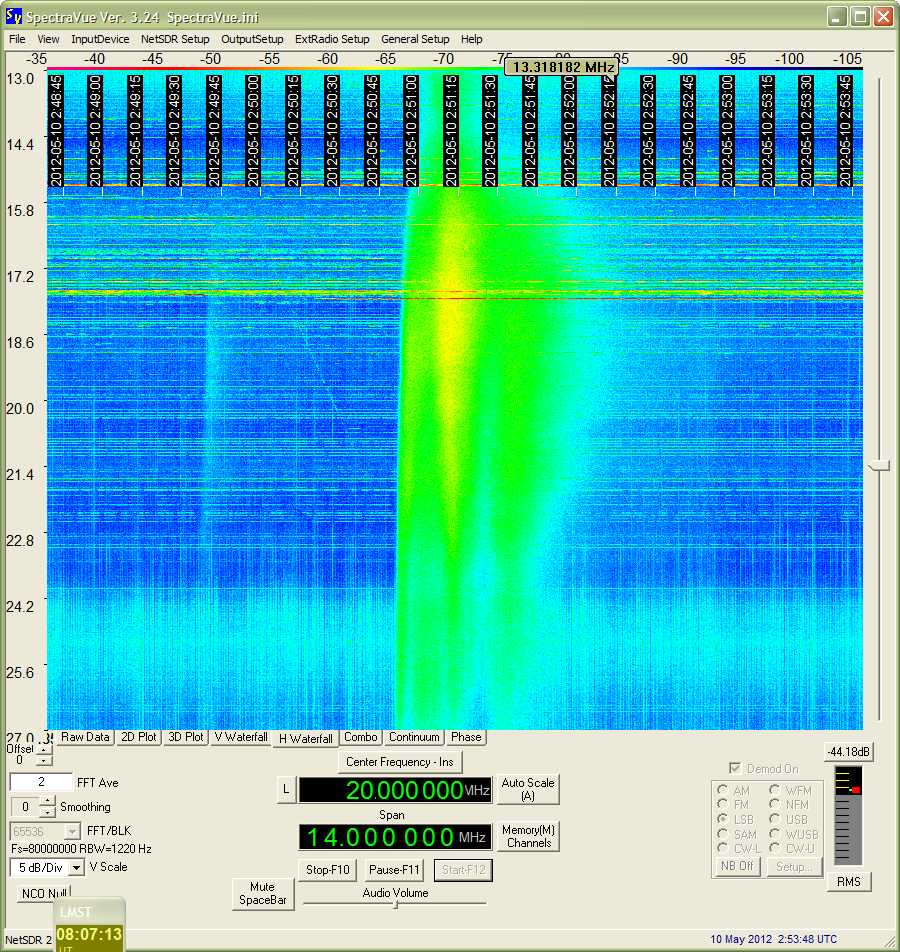
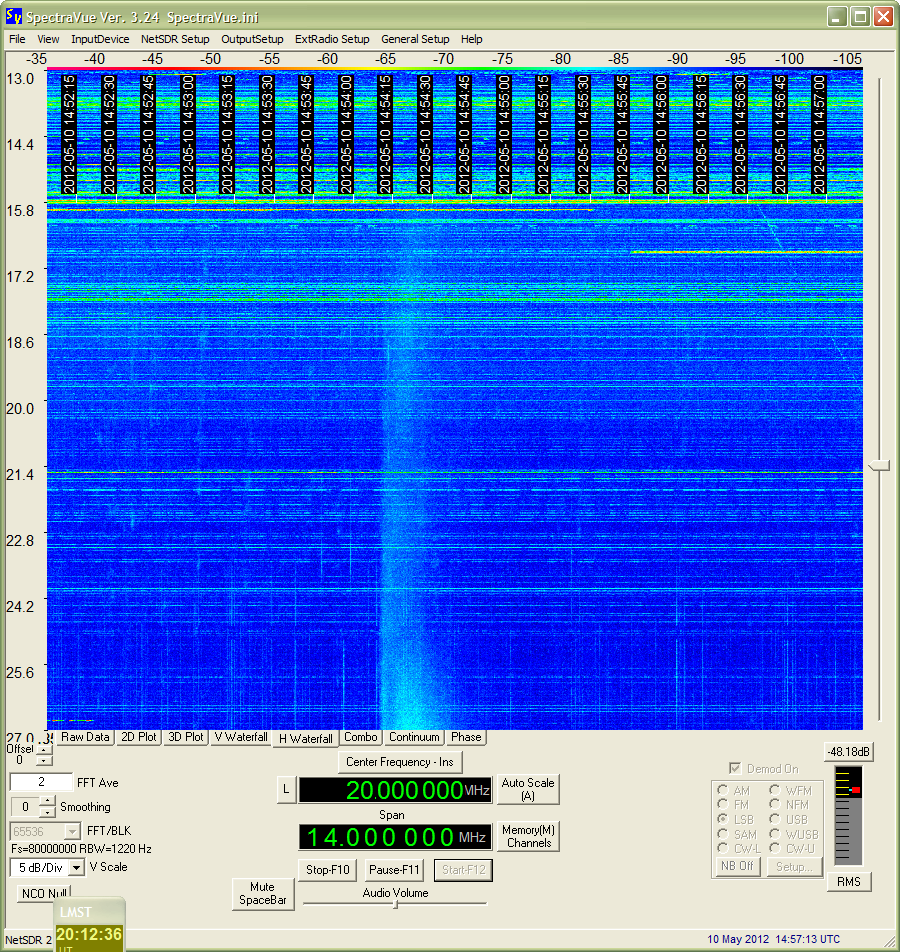
The above chart and accompanying spectrogram immediately below shows a quite strong solar burst reaching about 65 million kelvin. The chart trace frequencies are not marked but most probably are 19.2 and 24.9 MHz. Radio frequency interference is seen on the spectrogram as horizontal and vertical stripes.
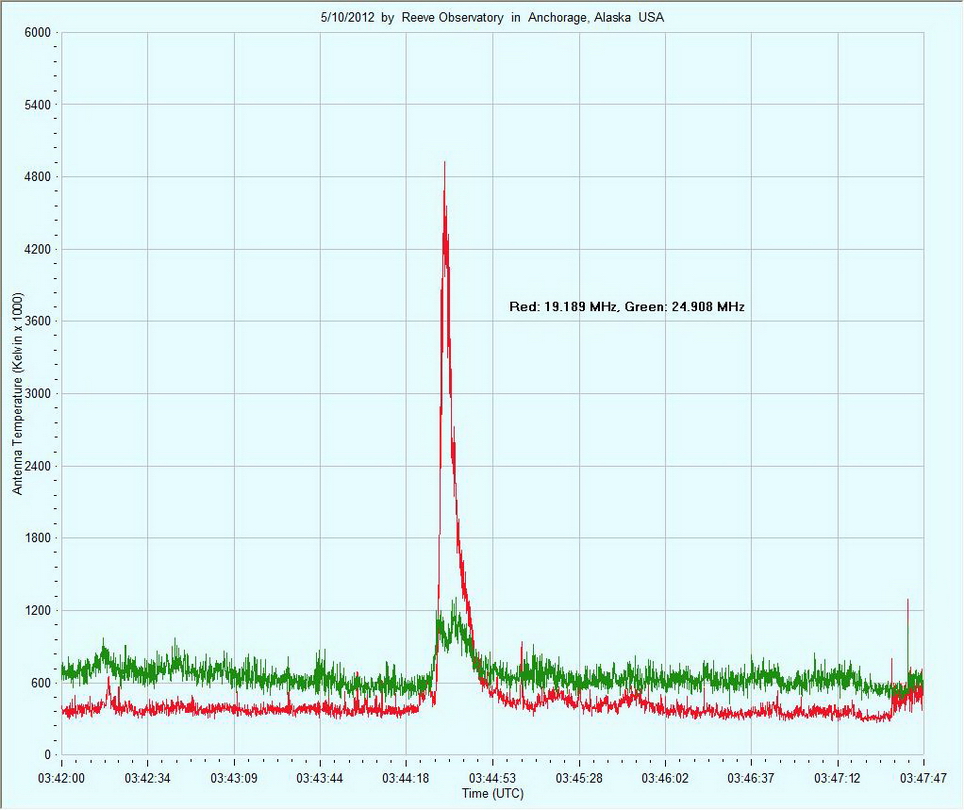
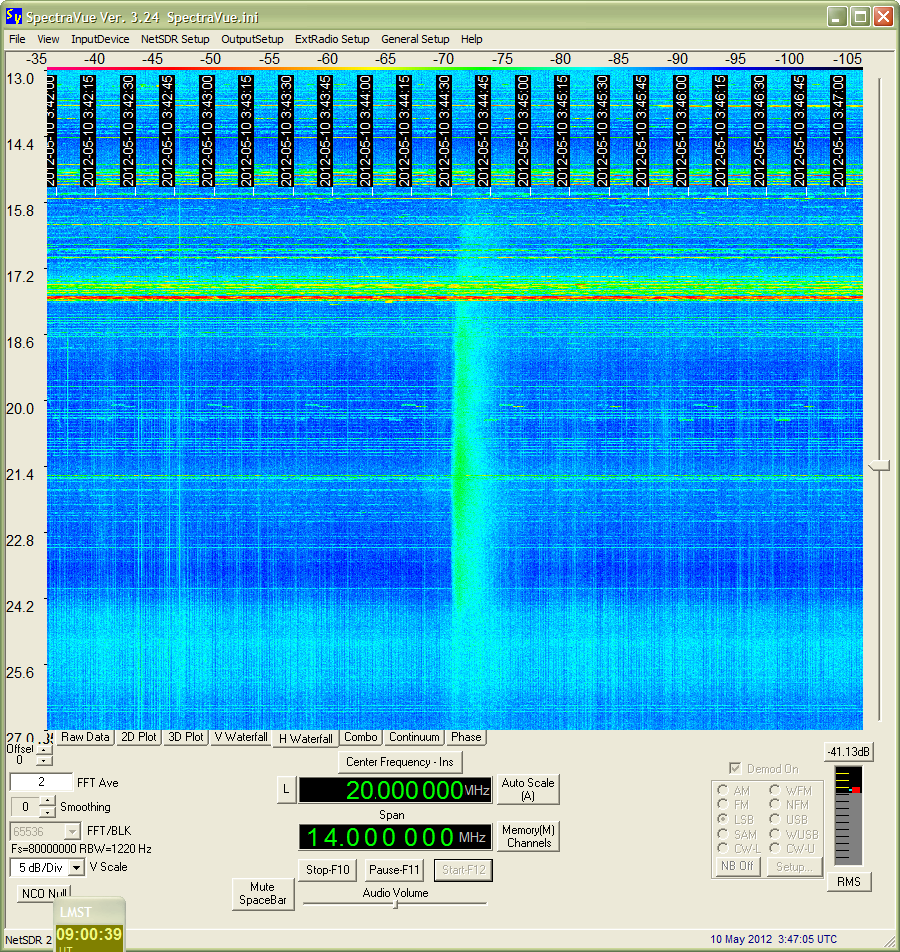
The chart above and accompanying spectrogram immediately below show a relatively weak solar burst at 0344. The bright horizontal band on the spectrogram is radio frequency interference.
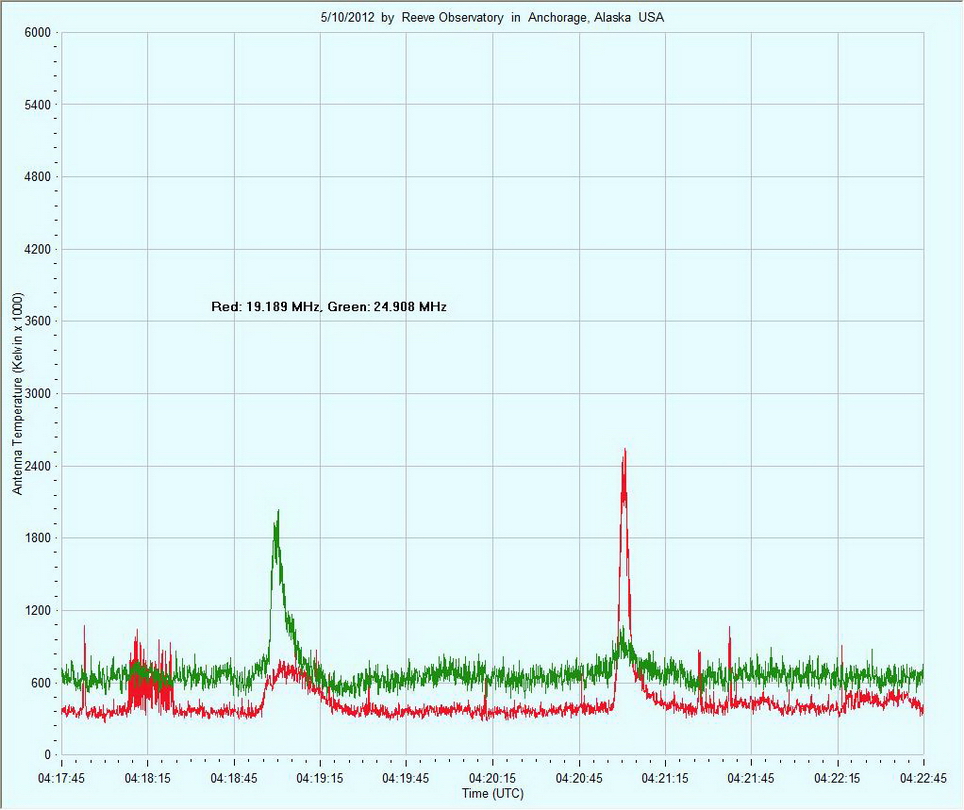
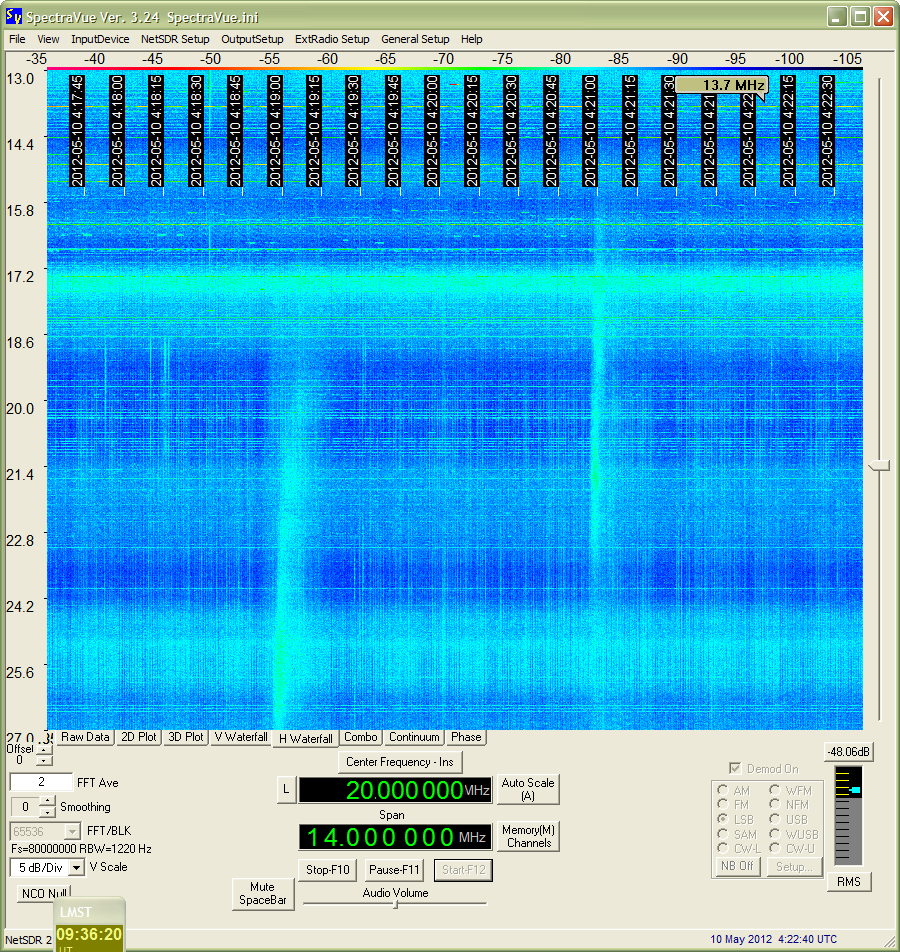
The solar burst shown in the chart above and accompanying spectrogram below show a pair of interesting bursts. The first one at about 01419 in the chart shows an emphasis at the higher frequency of 24.9 MHz while the second burst is emphasized at the lower frequency of 19.2 MHz. This also is evident in the spectrogram. There is a burst of radio frequency interference at 0418:15 on the chart at 19.2 MHz. RFI is seen as vertical and horizontal stripes on the spectrogram.
A weak Type III (fast sweep) solar burst can be seen at about 0450:15 on the above spectrogram along with large amounts of RFI.
The solar burst seen in the above spectrogram seems to emphasize higher frequencies and probably had significant power above the spectrogram range.
The chart above and spectrogram immediately below show a nice pair of solar bursts. The features at single frequencies in the chart also are detectable in the spectrogram. The spectrogram also shows considerable RFI as horizontal and vertical stripes.
Weak solar bursting can be seen in the above spectrogram as patchy areas among the horizontal and vertical interference stripes.
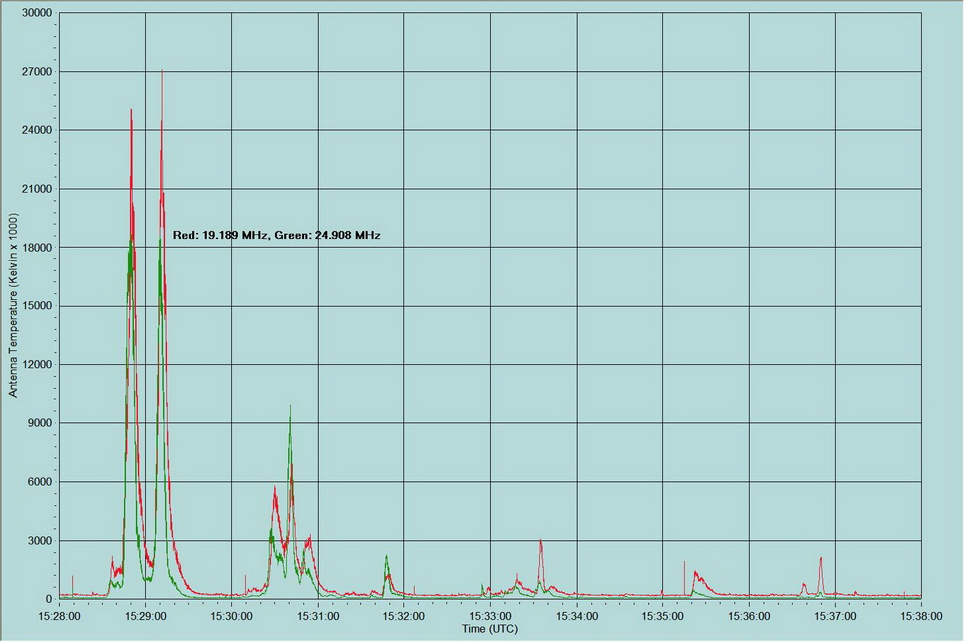
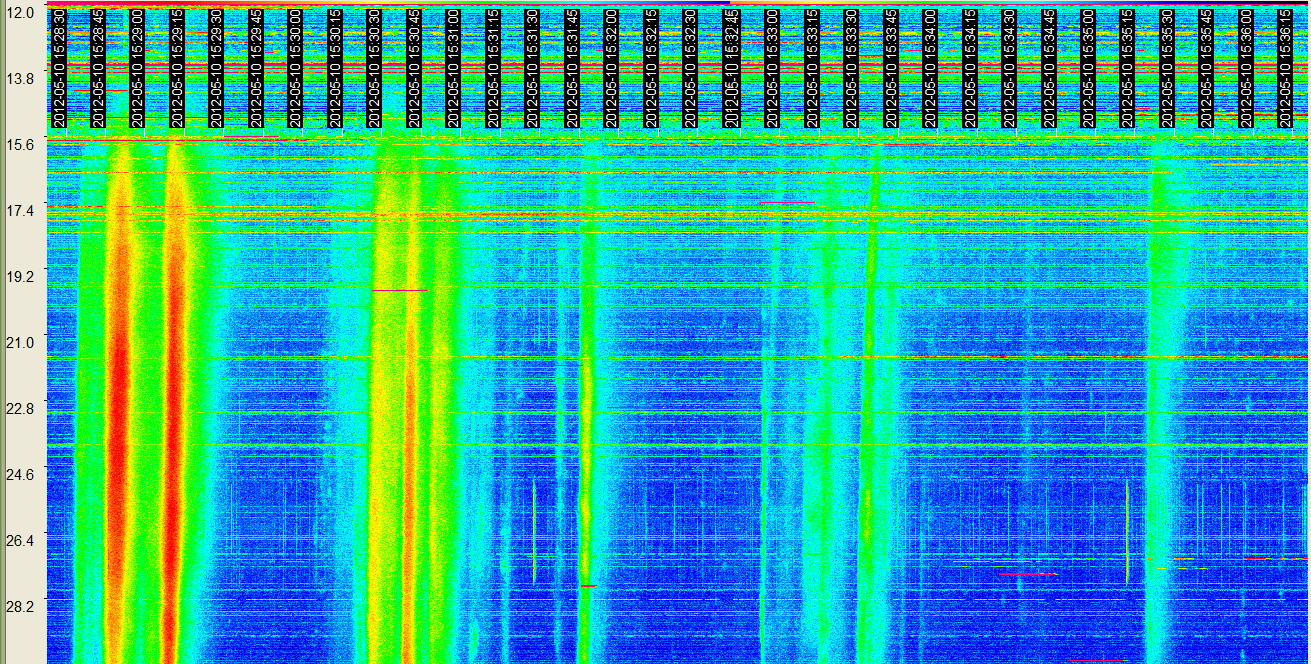
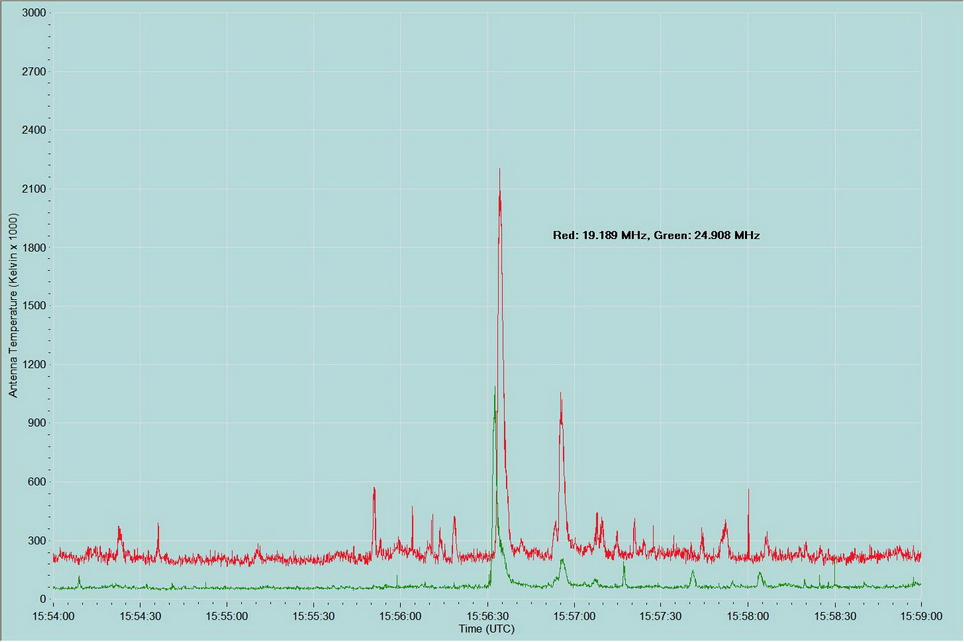
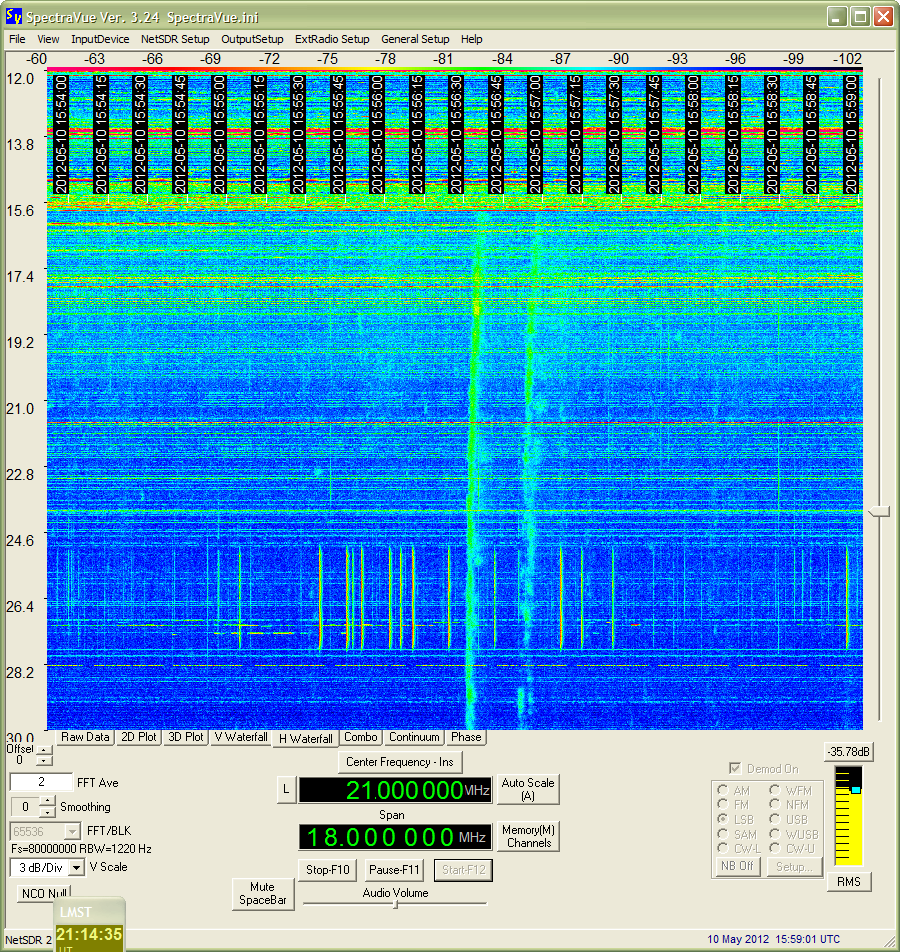
The chart above covers a 10 minute time period and the accompanying spectrogram below covers an 8 minute time period. The corresponding features of the individual bursts are easy to see. The initial bursts reached 27 million K. Click on the above chart to play audio for the 10 minute period from 1528 to 1538 (this is a very large audio file at about 27 MB).
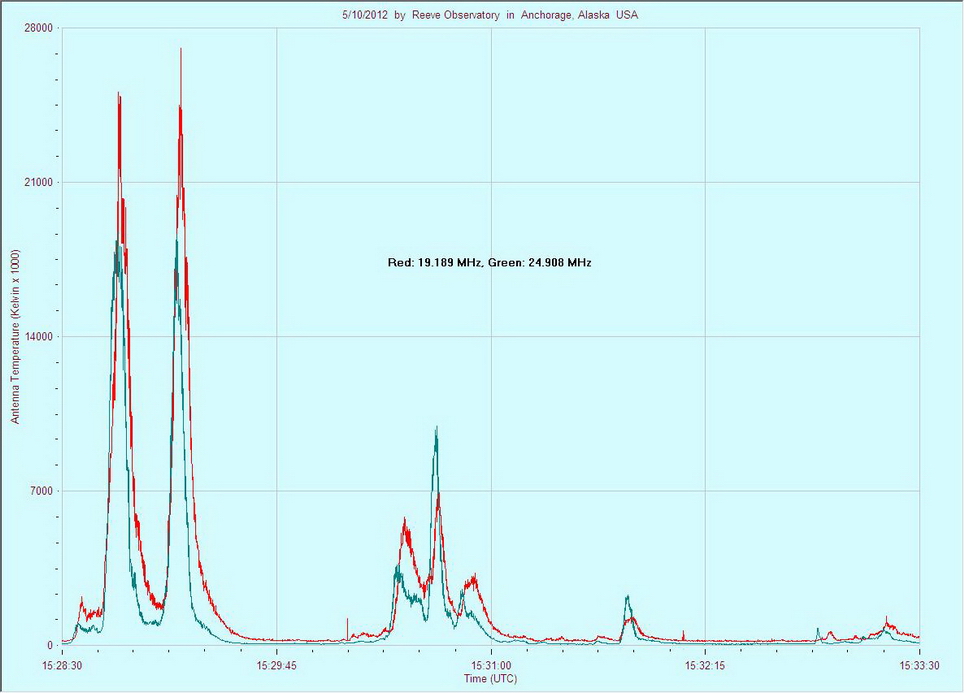
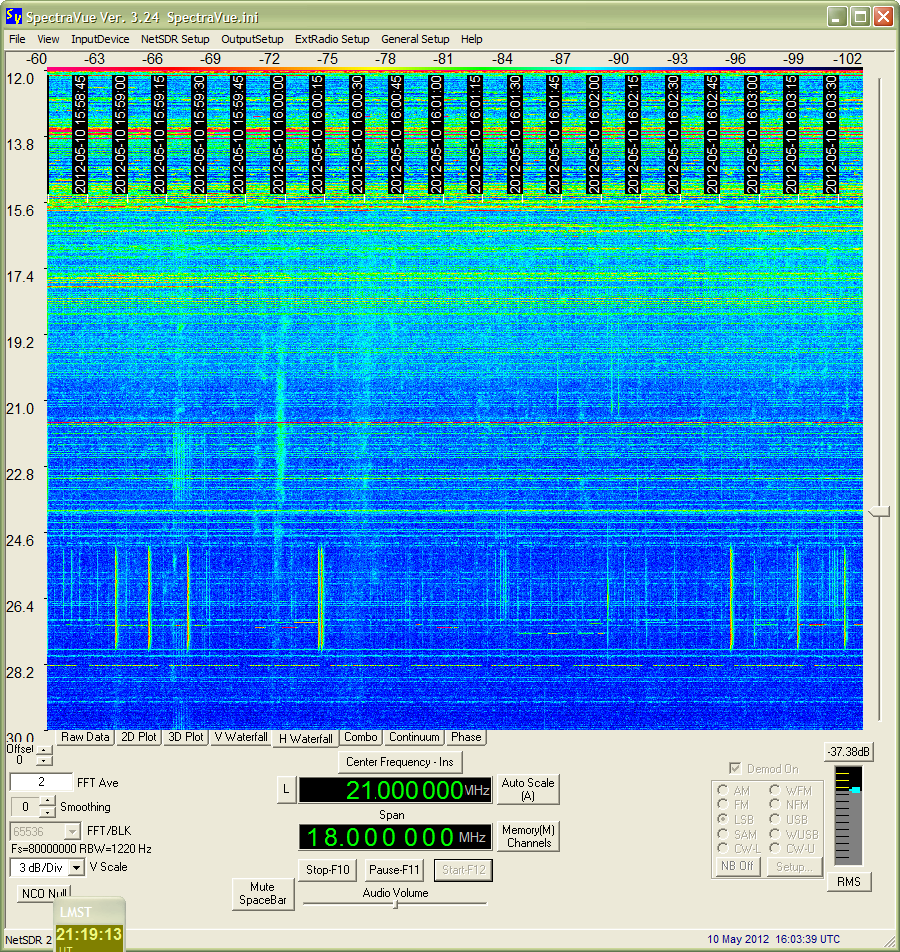
The chart above shows the initial 5 minute period of the sequence shown in the previous chart and spectrogram.
Several patchy areas can be seen in the above spectrogram along with a "main" burst at 1544:45.
The chart above corresponds in time with the spectrogram immediately below. This was not a particularly powerful burst but it had interesting features on the spectrogram.
The patchy areas in the spectrogram above are weak solar bursts. The vertical and horizontal stripes are RFI.
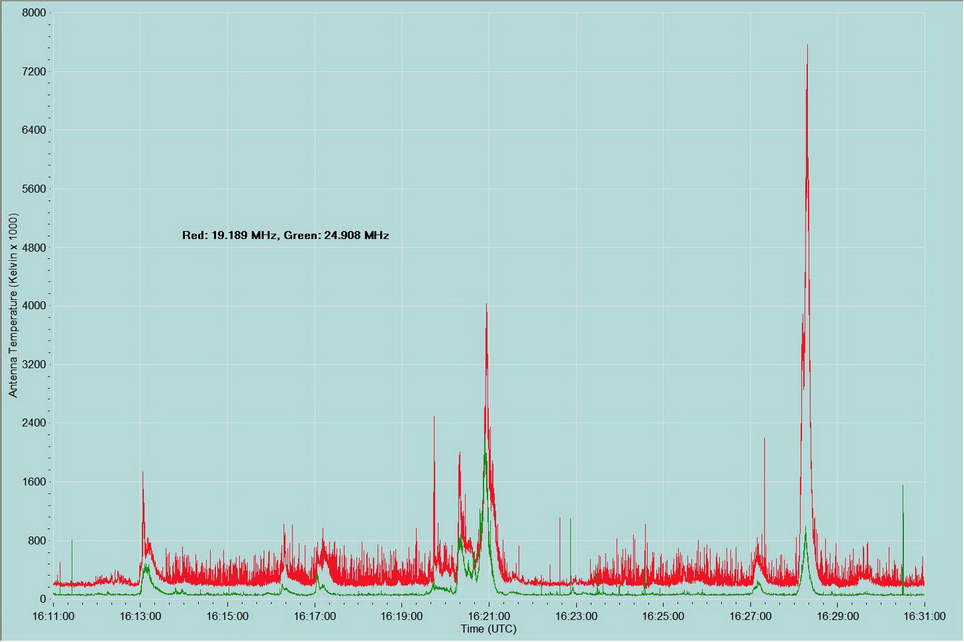
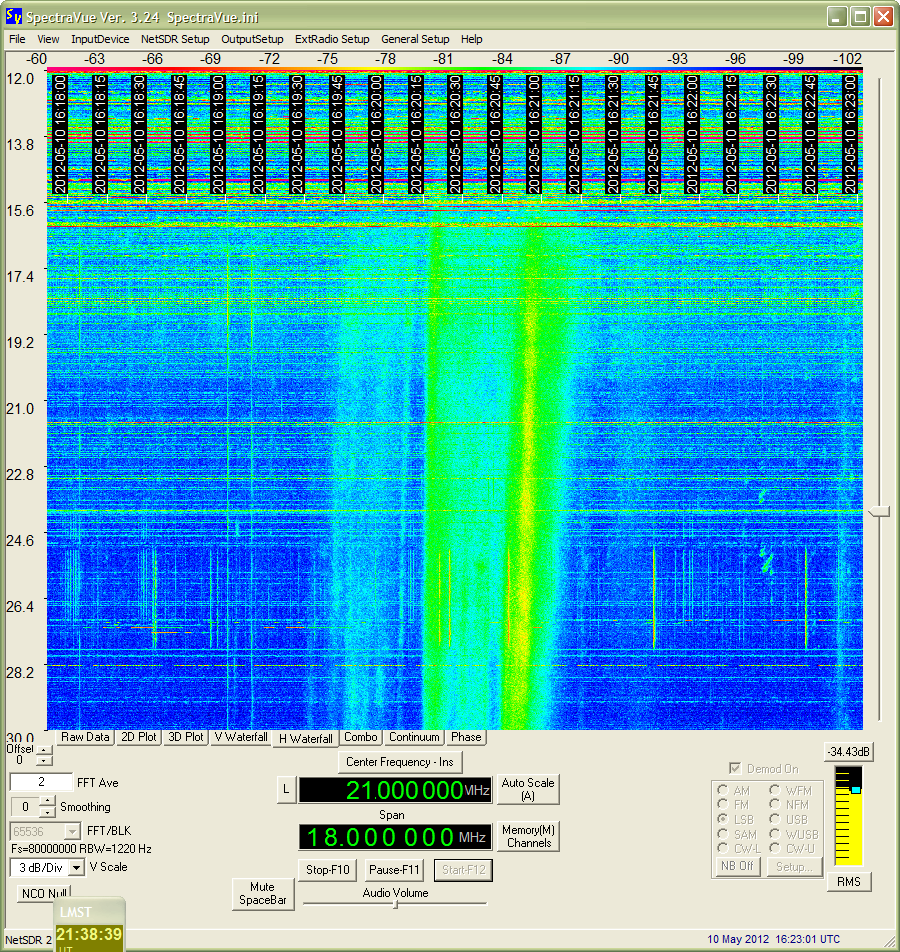
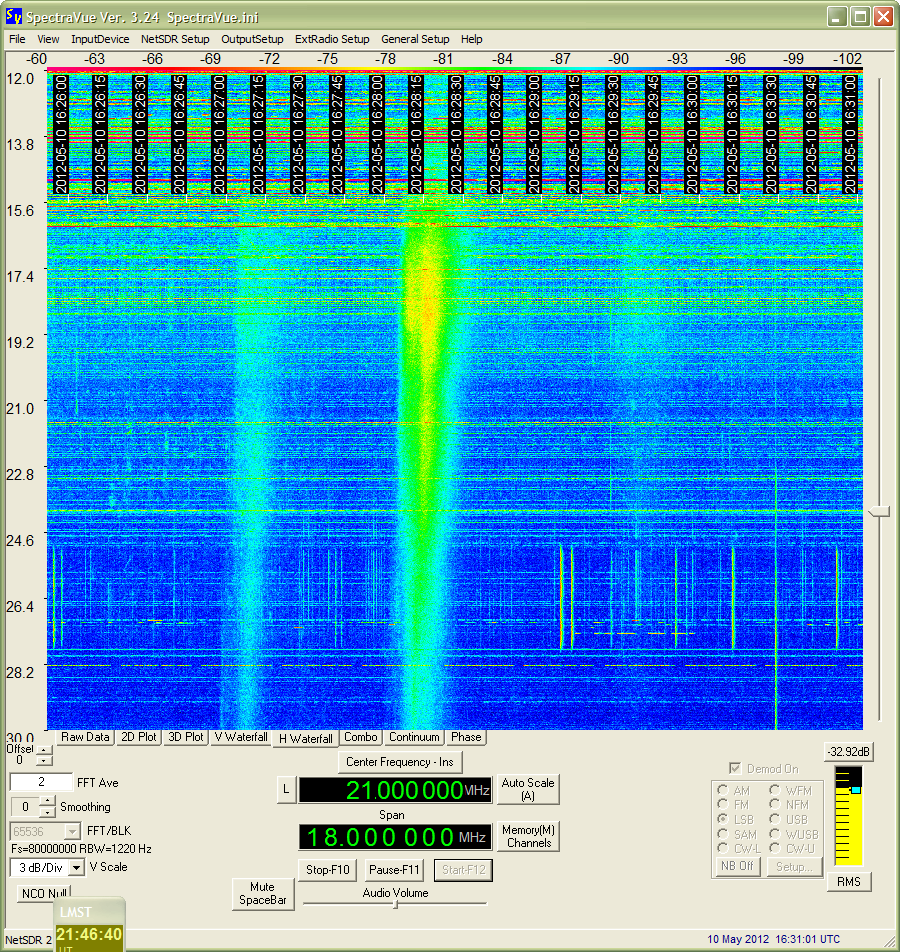
The chart above shows a 20 minute time span with several solar bursts. The four spectrograms immediately following show selected 5 minute time spans within the same time period as the chart. Click on the chart above to play audio for the burst at 1620.
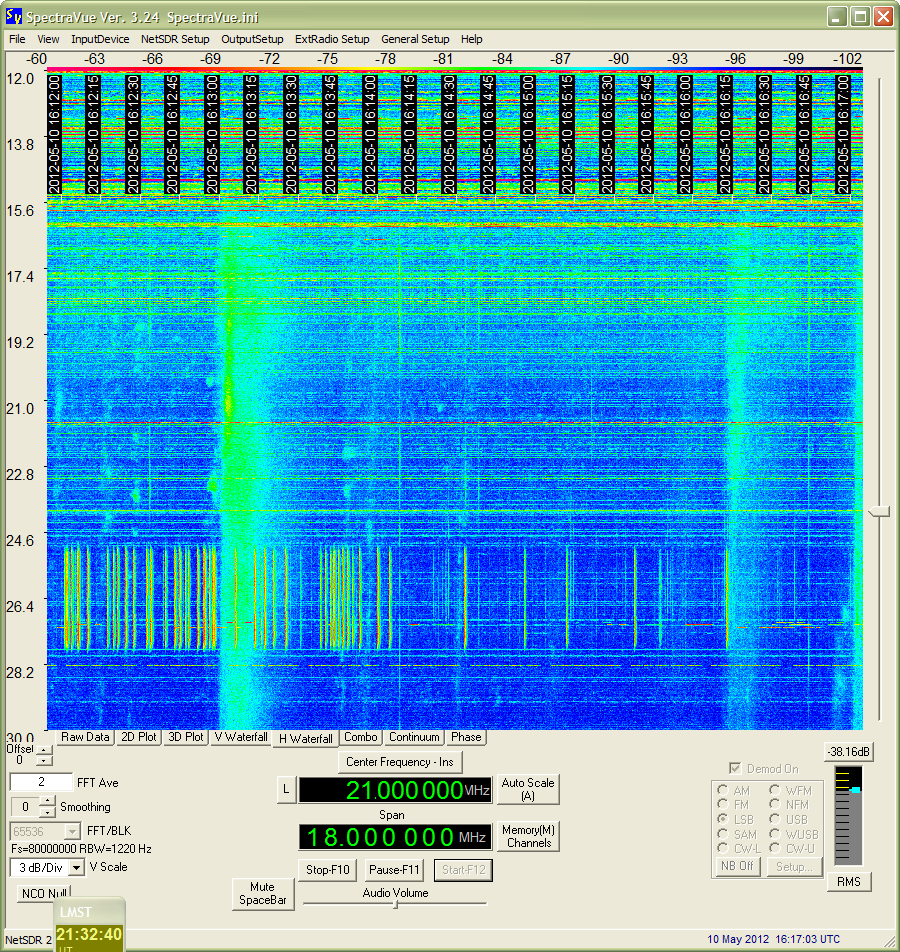

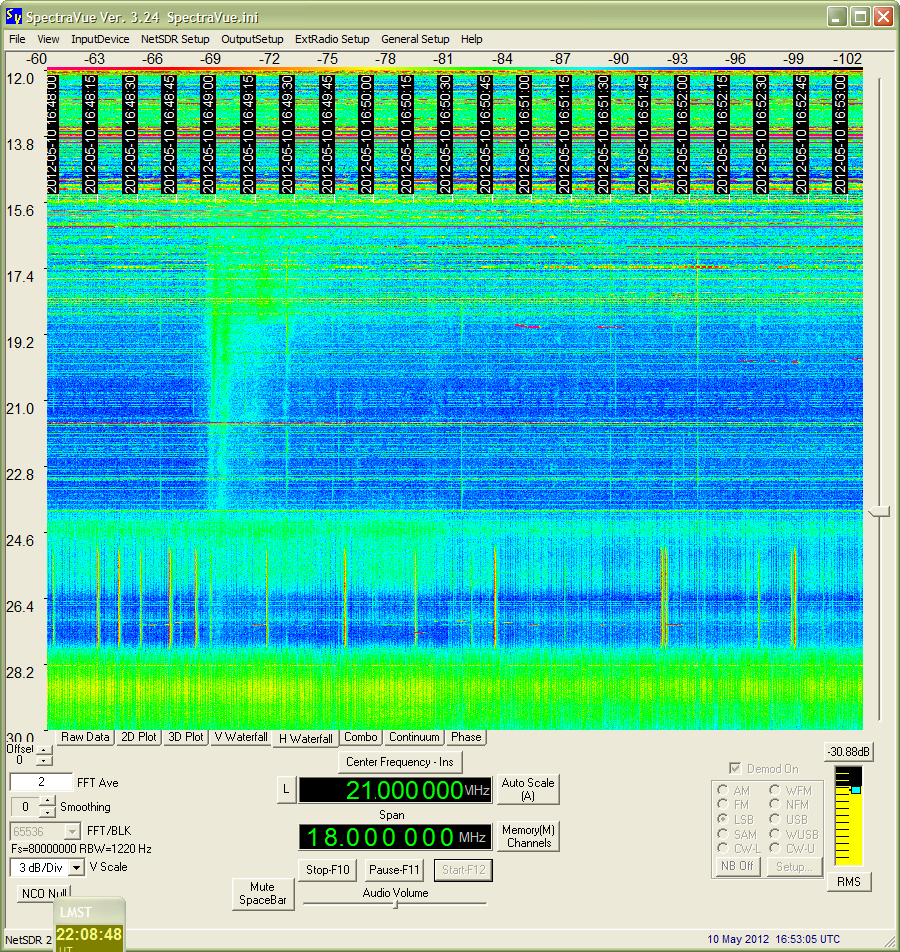
A weak solar burst can be seen in the above spectrogram at about 1649.
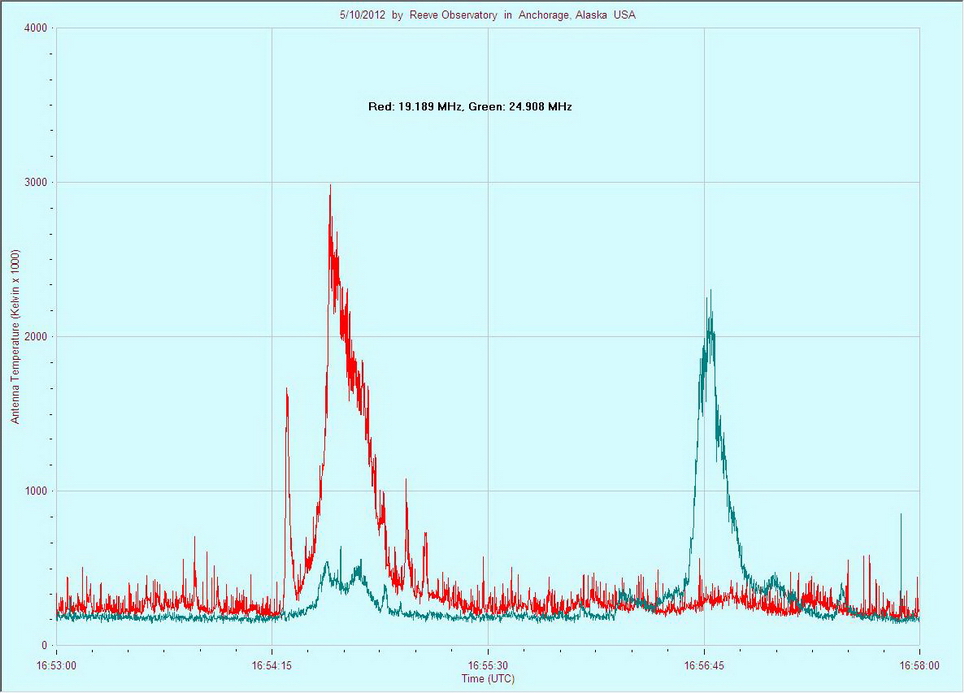
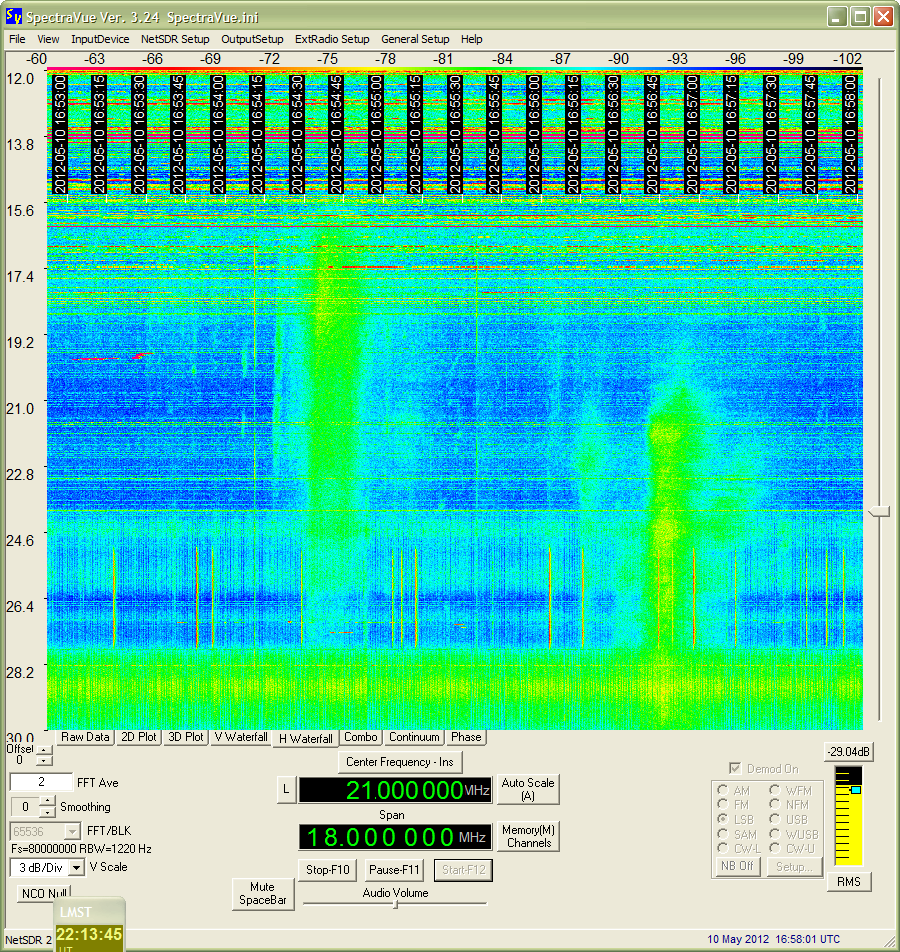
Click on the above chart to hear audio associated with the two bursts. Note that the first burst emphasized the lower frequency while the second burst emphasized the higher frequency. The accompanying spectrogram below also shows this characteristic. Also note that the second burst on the spectrogram has an interesting shape, somewhat like a Saguaro Cactus.
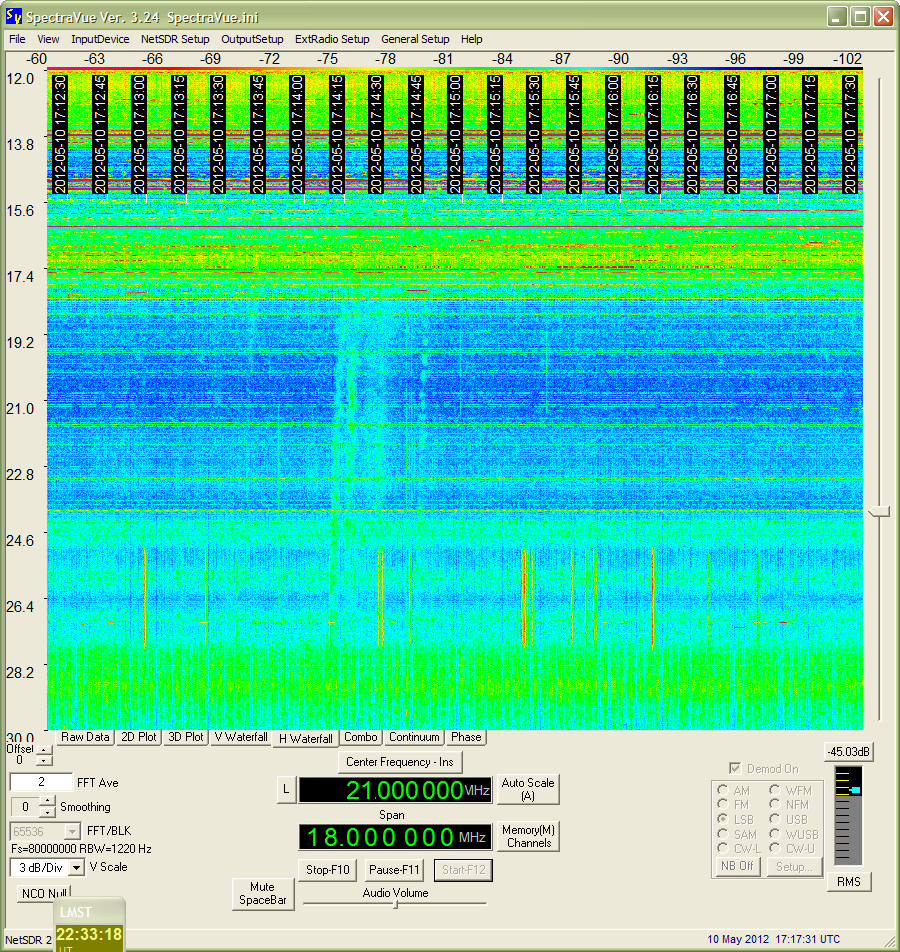
A series of weak solar bursts can be seen in the above spectrogram from approximately 1713:45 to 1715:45.
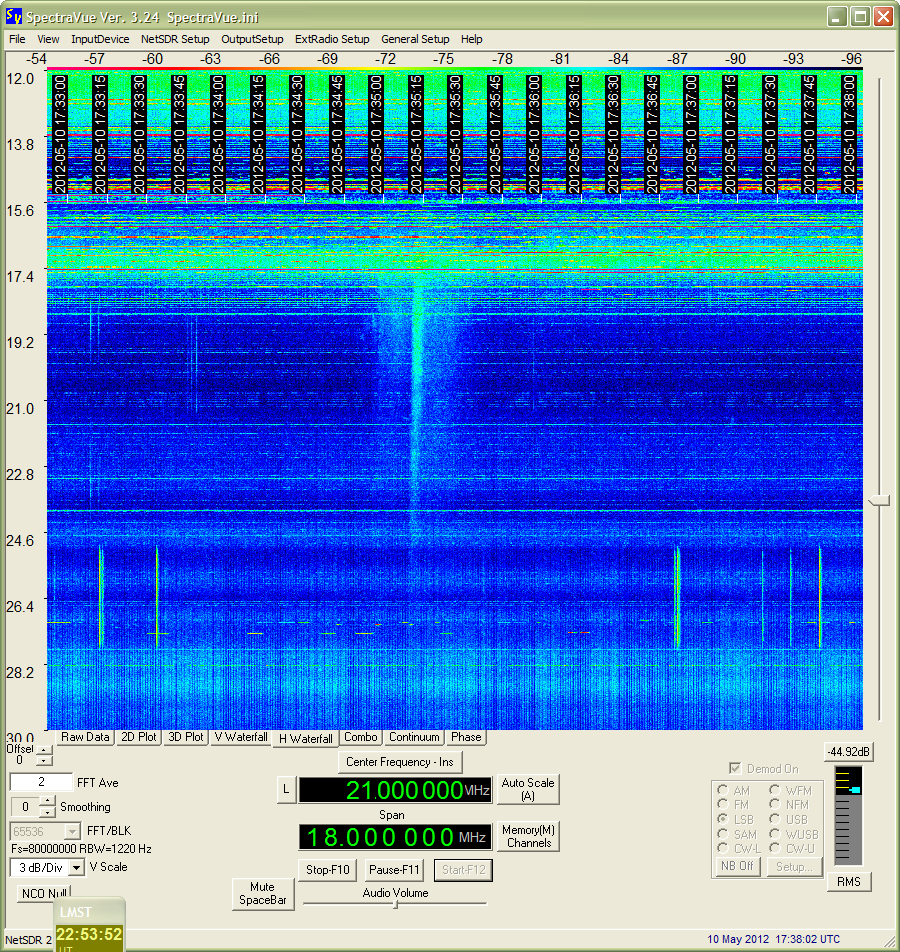
The solar burst shown in the above spectrogram at 1735:15 has characteristics of a Type III (fast sweep) burst and is surrounded by cocoon of additional frequencies.
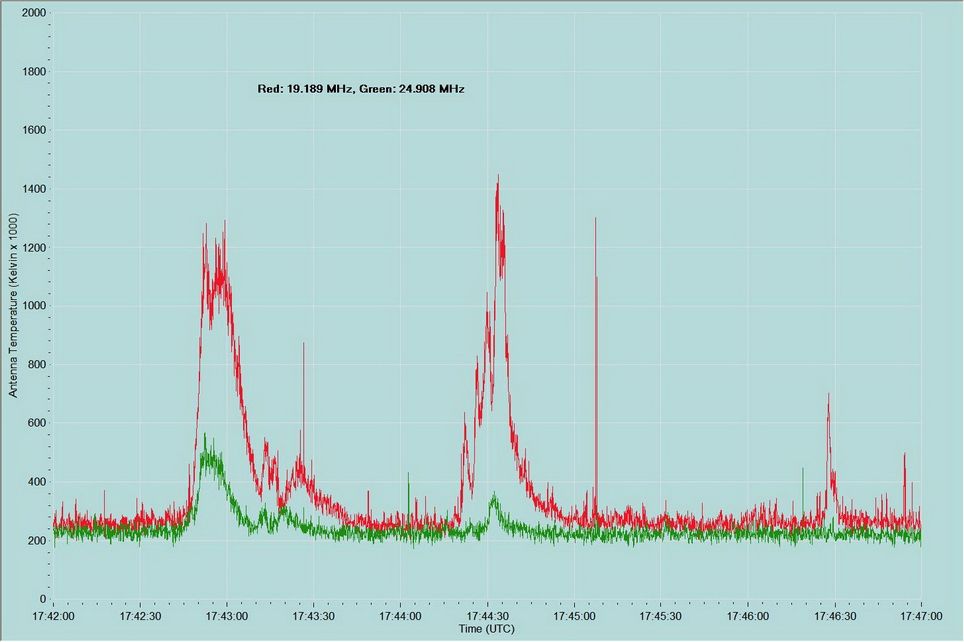
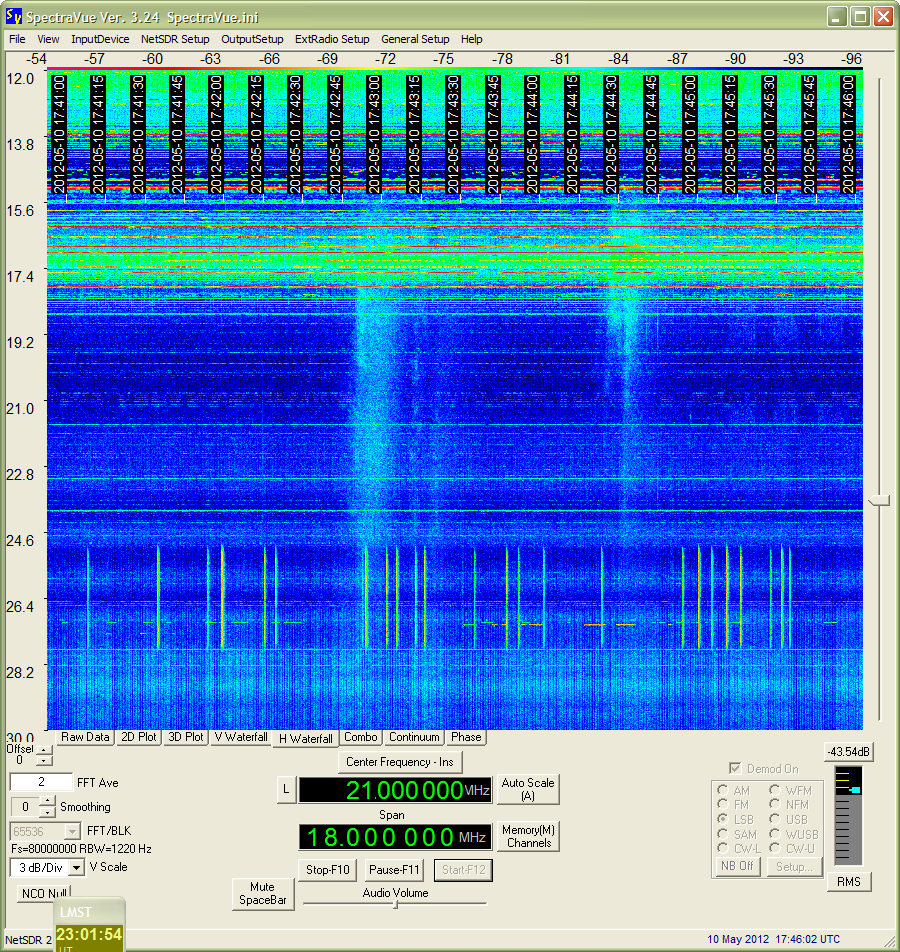
The solar bursts shown in the above chart and accompanying spectrogram immediately below were relatively weak and occurred during strong RFI.
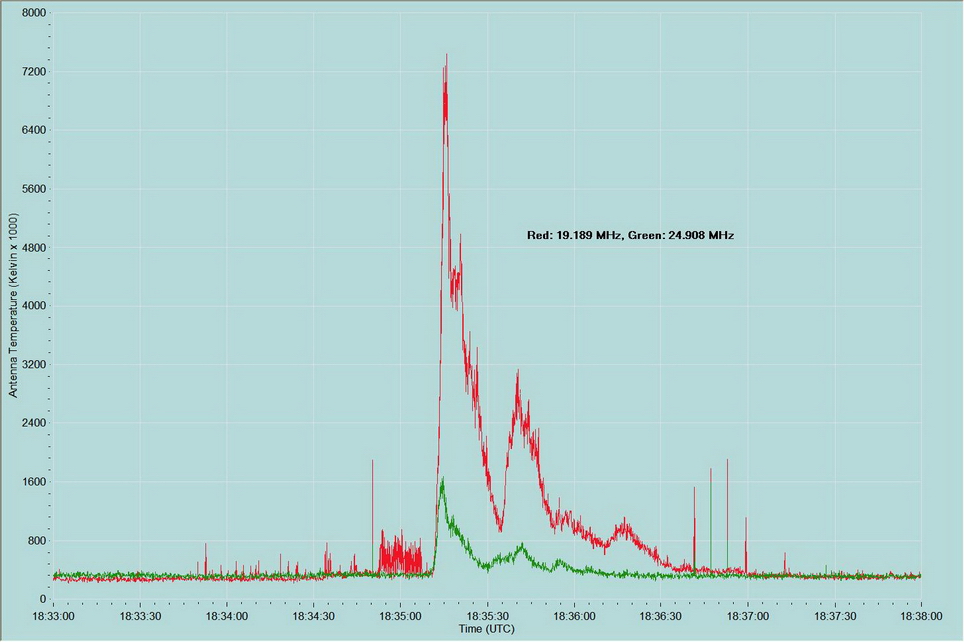
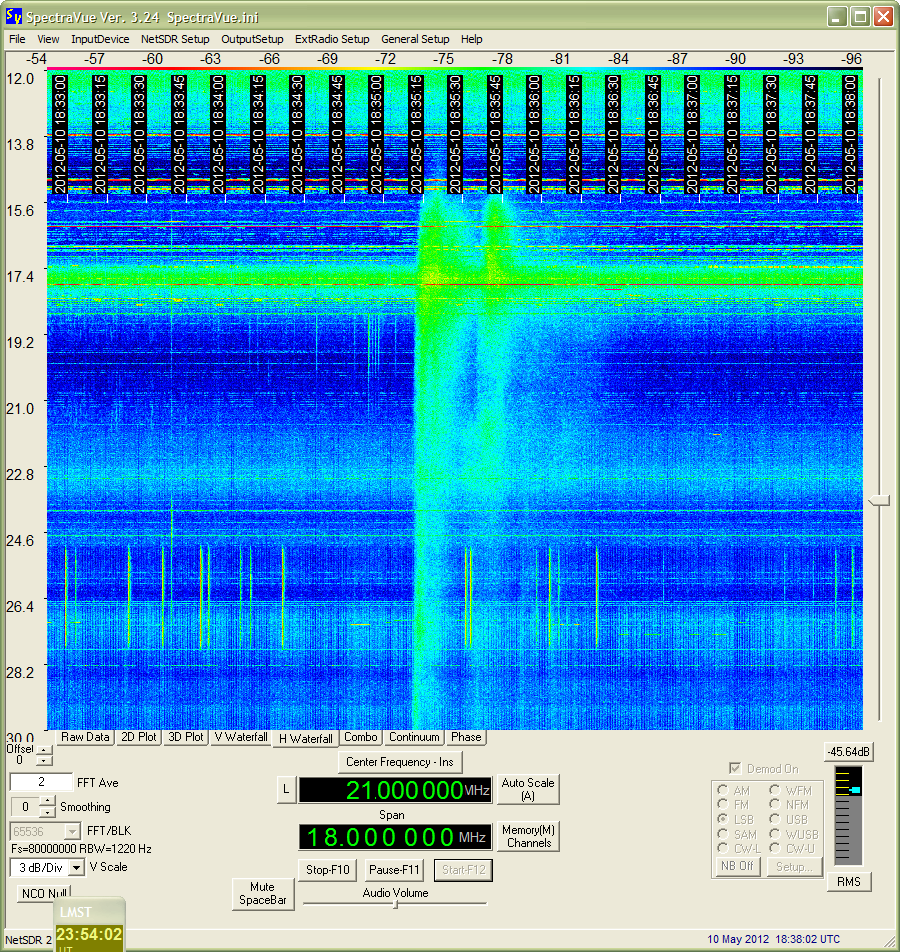
Click on the chart above for a 1 minute audio recording of the burst shown. The recording starts just after the burst of interference at 1835. The accompanying spectrogram immediately below shows additional features of the burst.
The above spectrogram shows what appear to be weak frequency selective solar bursts at 1914:45. RFI is seen as horizontal stripes and bands and vertical stripes.
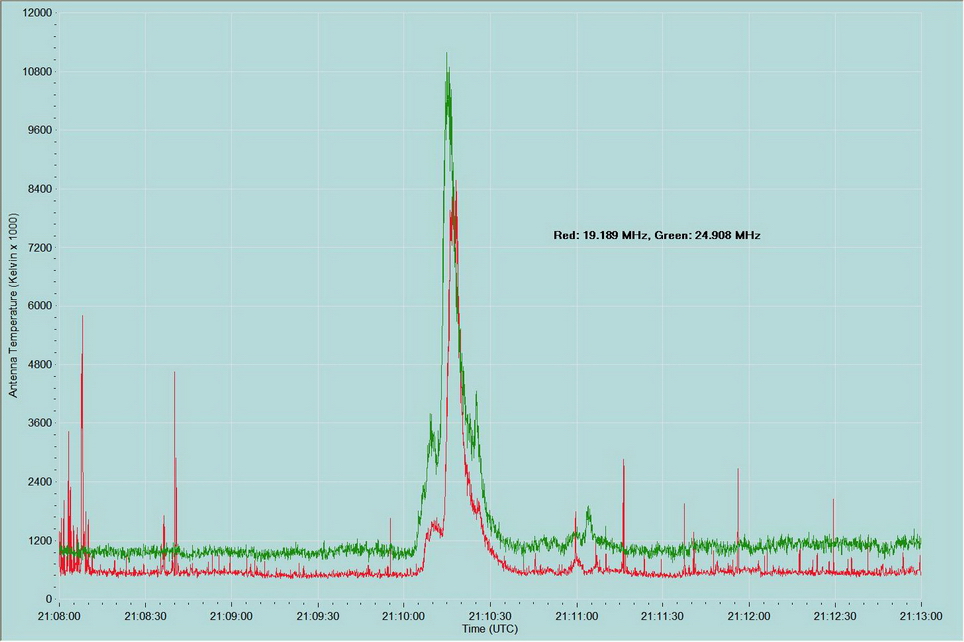
The above chart is interesting because the higher frequency shows more power than the lower frequency. Click on the chart for an audio recording of this burst.