Solar Radio Observations for 17 May 2012
Where needed, additional descriptive information is provided below the images. No audio is available for these charts.
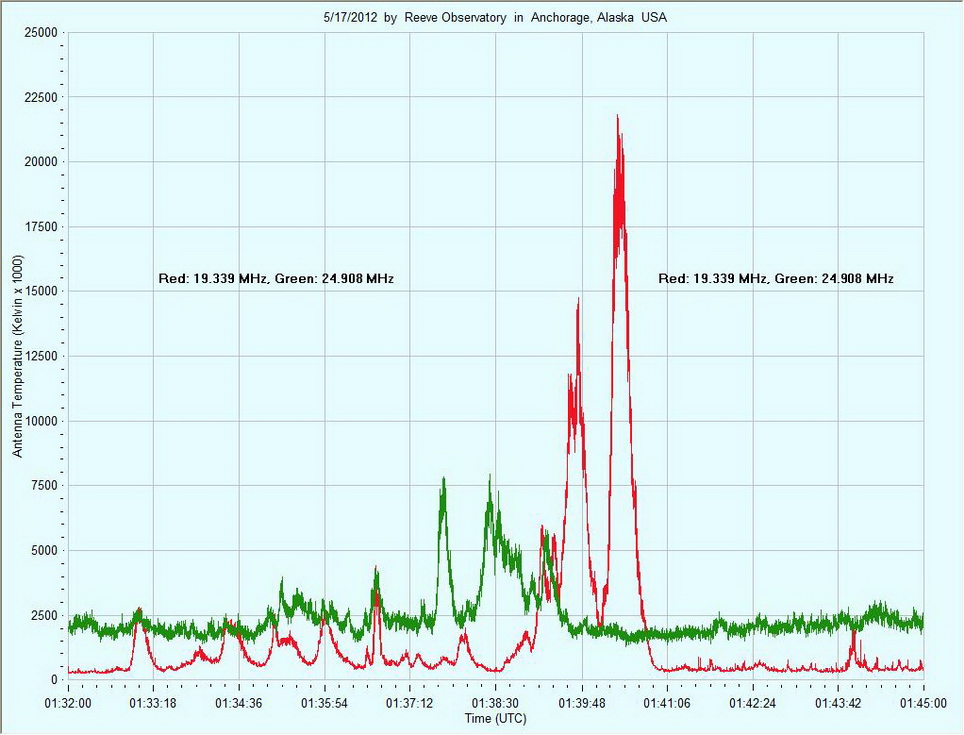
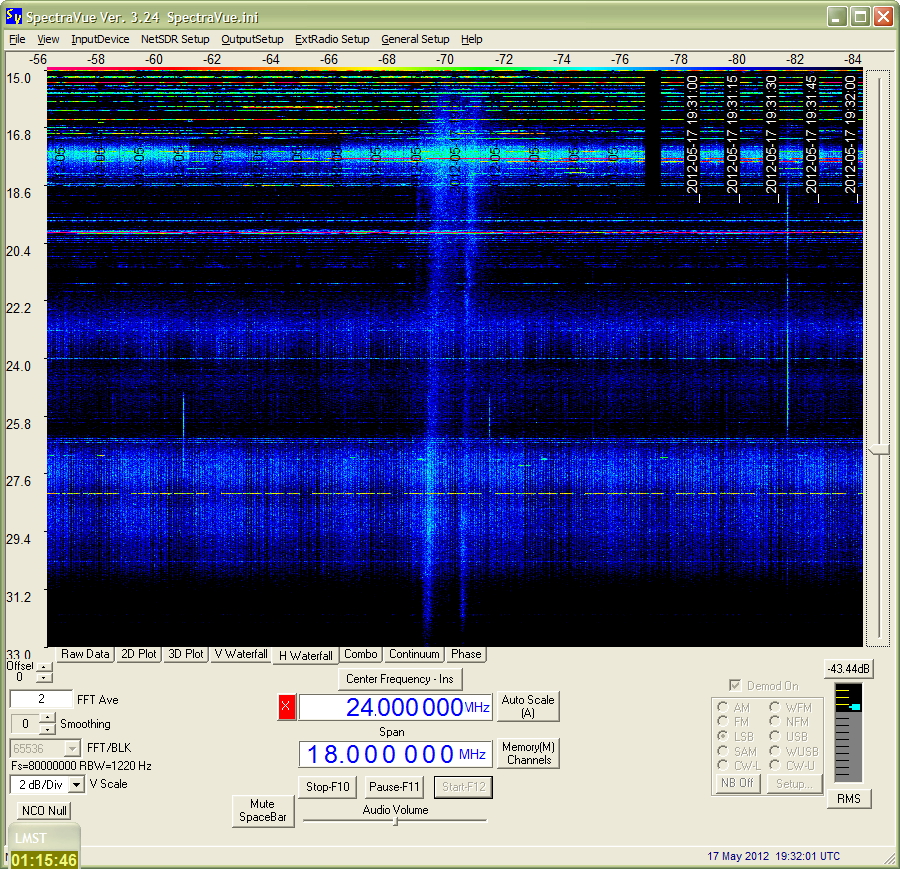
The chart above covers a 13 minute time period from 0132 to 0145 and the accompanying spectrogram below covers a 9 minute time period from 0132 to 0141. The solar bursting shown here are quite complex and cover a wide frequency range and types including Type II (slow sweep), Type III (fast sweep) and Type IV (broadband smooth continuum burst). The spectrogram clearly shows that the peak power occurred at higher frequencies but that is not apparent from the chart, which shows two single frequencies.
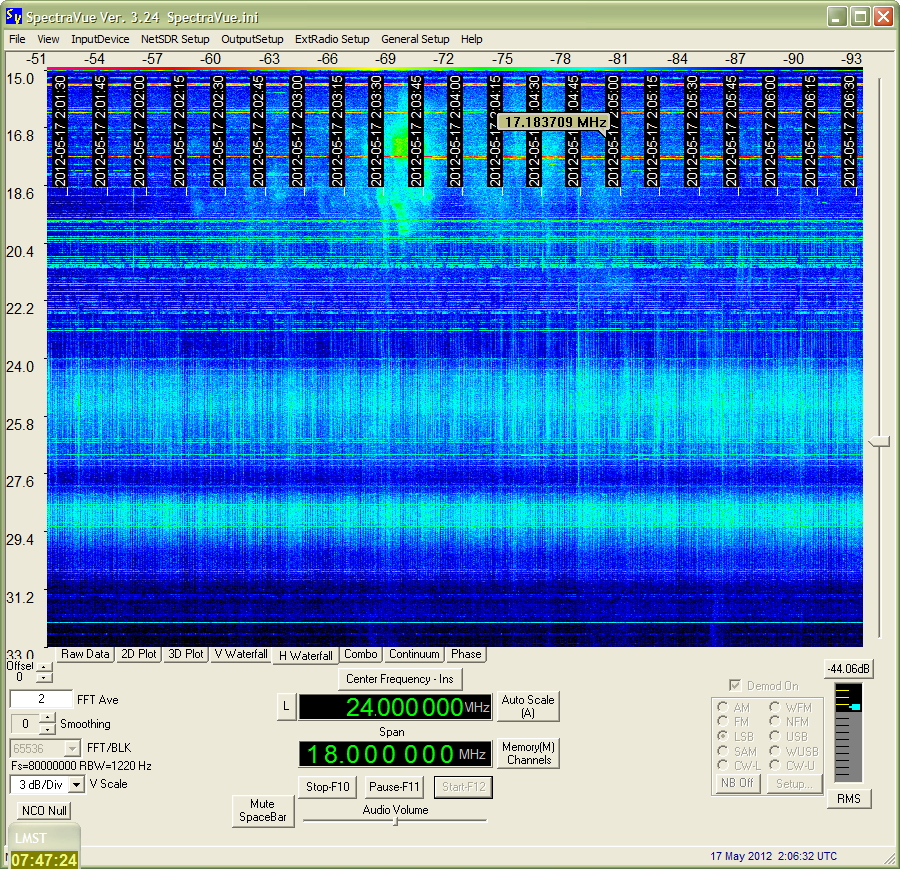
The spectrogram above shows a brief solar burst at 0203:30 that covered only a limited frequency range near 17 MHz.
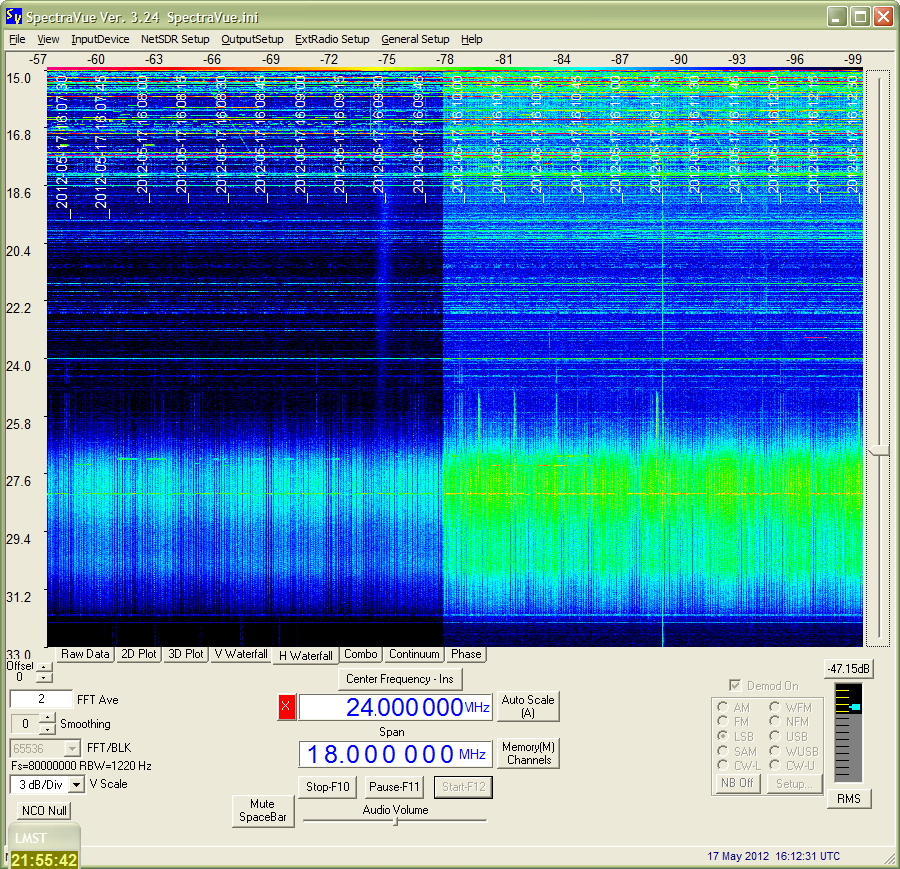
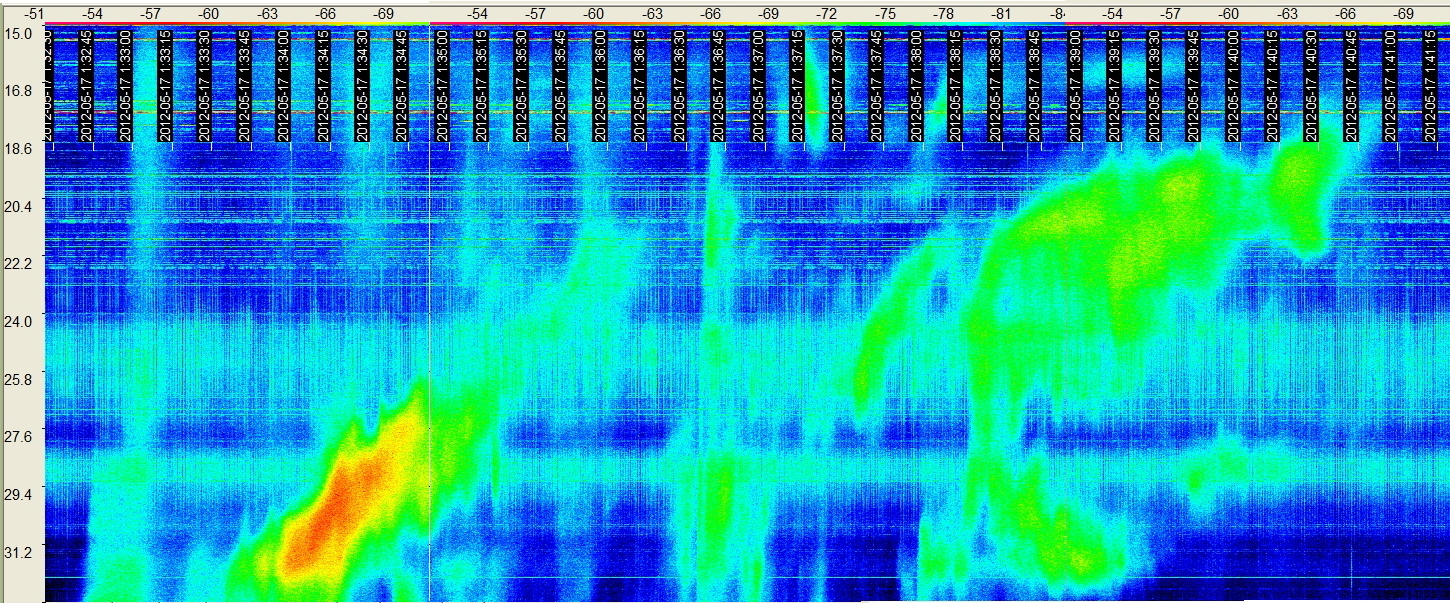
The spectrogram above shows a Type III (fast sweep) solar burst at 1609:30 followed by a color scale change.
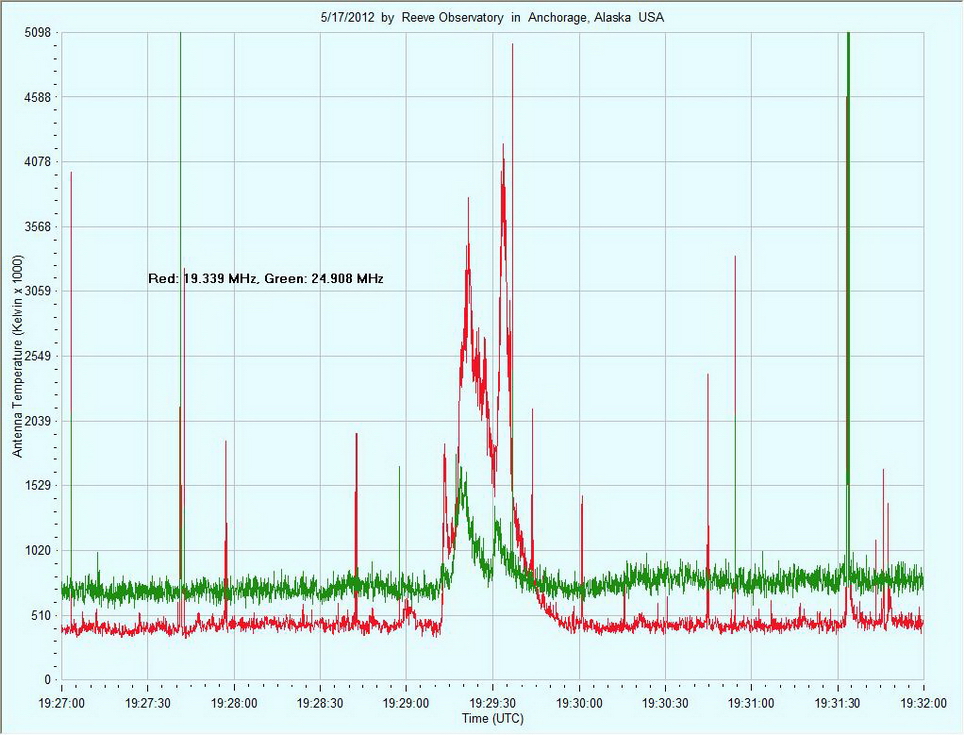
The chart above and accompanying spectrogram immediately below show a burst that appears on the chart to be a single burst but on the spectrogram appears to be two separate bursts.